TRENDS IN HIGHER EDUCATION SERIES
Trends in
College Pricing
and Student
Aid 2022
COLLEGE
PRICING
STUDENT
AID
Trends in College Pricing and Student Aid 2022 was authored by Jennifer Ma and
Matea Pender, both senior policy research scientists at College Board.
Contact Information for the Authors
trends@collegeboard.org
Tables, graphs, and data in this report or excerpts thereof may be reproduced or
cited, for noncommercial purposes only, provided that the following attribution
is included:
Source: Ma, Jennifer and Matea Pender (2022),
Trends in College Pricing and Student Aid 2022, New York: College Board.
© 2022 College Board.
w
ww.collegeboard.org
research.collegeboard.org/trends
ACKNOWLEDGMENTS
We thank Dean Bentley, Jessica Howell, and Michael Hurwitz for their thoughtful
reviews. We also thank the cooperation and support of many colleagues at
College Board, including Connie Betterton, Mark Bloniarz, Auditi Chakravarty,
Karen Lanning, Kevin Morris, Jose Rios, Ashley Robinson-Spann, Michael Slevin,
Kayla Tompkins, Chris Villanueva, Marquis Woods, and the Annual Survey of
Colleges team.
We thank all of those who contributed to the data collection for this publication,
campus administrators who provided us with invaluable data through the Annual
Survey of Colleges.
DEFINING TERMS
“Costs” refer to the expenditures associated with
delivering instruction, including physical plant
and salaries.
“Prices” are the expenses that students and
parents face.
“Published price” is the price institutions charge for
tuition and fees as well as room and board, in the
case of students residing on campus. A full student
expense budget also includes allowances for books
and course materials, supplies, transportation, and
other personal expenses.
“Net price” is what the student and/or family must
cover after grant aid is subtracted.
“General subsidies” make it possible for institutions
to charge less than the actual costs of instruction.
State, federal, and local appropriations, as well as
private philanthropy, reduce the prices faced by all
MAR-5555
October 2022
Highlights
TRENDS IN COLLEGE PRICING
PUBLISHED TUITION AND FEES AND ROOM
AND BOARD
In 2022-23, the average published (sticker) tuition and fees for
full-time undergraduate students are (Table CP-1):
w
Public four-year in-state: $10,940, $190 higher than in 2021-22
w
Public four-year out-of-state: $28,240, $620 higher than in
w
Public two-year in-district: $3,860, $60 higher than in 2021-22
w
w
In 2022-23, average estimated budgets (tuition and fees, room
and board, and allowances for books and supplies, transportation
and other personal expenses) for full-time undergraduate
students range from $19,230 for public two-year in-district
students and $27,940 for public four-year in-state students to
$45,240 for public four-year out-of-state students and $57,570
Over the 30 years between 1992-93 and 2022-23, average
published tuition and fees increased from $2,340 to $3,860
at public two-year, from $4,870 to $10,940 at public four-year,
adjusted tuition and fees declined by 4% at public two-year colleges,
declined by 1% at public four-year institutions, and increased by 6%
In 2022-23, average published tuition and fees for full-time
in-district students at public two-year colleges range from $1,430
2021-22 to 2022-23, the average published in-district tuition and
fees at public two-year colleges did not increase in eight states,
In 2022-23, average published tuition and fees for full-time
in-state students at public four-year institutions range from $6,370
published four-year in-state tuition and fees did not increase in nine
NET PRICES AFTER GRANT AID
full-time students, including those who did not receive grant
aid. In 2019-20, 75% of public two-year, 78% of public four-
undergraduate students received federal, state, or institutional
grant aid. (Pages 17, 18, and 19)
colleges have been receiving enough grant aid on average to
Since 2016-17, the average net tuition and fee price paid by
Since 2017-18, the average net tuition and fee price paid by
four-year institutions has been declining after adjusting for
INSTITUTIONAL FINANCES
The national average state and local funding per student increased
year. State and local funding per student reached $9,330 in 2020-21,
In 2019-20, net tuition revenue accounted for 41% of total revenues
at public doctoral universities. Net tuition as a share of total
revenues in this sector remained stable between 2014-15 and
years. At other types of public institutions, net tuition as a share
of total revenues declined between 2014-15 and 2019-20, after
Between 2014-15 and 2019-20, the average subsidy per full-time
ENROLLMENT TRENDS AND FAMILY INCOME
Between 1991 and 2021, the average income increased by 64%
for the top quintile of families and by 17% for the lowest quintile of
Between fall 2019 and fall 2020, total postsecondary enrollment
fell by 631,000 (3%). The public two-two sector saw the largest
decline in enrollment—581,000 or 9%. Total enrollment at the
declined by 0.7% while enrollment increased by 33,000 (3%)
Between fall 2010 and fall 2020, total enrollment declined by 1.3
million (8%) at public colleges and universities in the United States.
Changes across states ranged from declines of 35% in Alaska and
Between fall 2010 and fall 2020, the shares of undergraduate
students who were Asian, Hispanic, or two or more races
increased while the shares of undergraduate students who were
Black, White, or Native declined. The share of undergraduate
students who were Hispanic increased from 14.5% in fall 2010 to
3
TRENDS IN STUDENT AID
TYPES OF STUDENT AID
In 2021-22, undergraduate students received an average of
$10,590 in grants, $3,780 in federal loans, $870 in education tax
In 2021-22, graduate students received an average of $27,300
federal loans, $440 in tax credits and deductions, and $60 in
In 2021-22, undergraduate and graduate students received a
federal loans, and federal tax credits and deductions. In addition,
students borrowed about $12.7 billion from nonfederal sources.
(Table SA-1 online)
FEDERAL STUDENT AID
dollars between 2011-12 and 2021-22. Pell Grants declined by
($2.3 billion). (Table SA-1 online)
were nearly $15,000, compared with $4,250 per Pell Grant
recipient. There were 6.1 million Pell Grant recipients compared
Between 2011-12 and 2021-22, federal loans to undergraduates
fell by 50%, while federal loans to graduate students declined by
PELL GRANTS
Total Pell Grant expenditures reached its peak in 2010-11 at
$44.3 billion (in 2021 dollars) and declined to $25.9 billion in
The number of Pell Grant recipients was 9.3 million in 2010-11 and
The average Pell Grant per recipient was $3,520 (in 2021 dollars)
in 2001-02. It peaked at $4,760 in 2010-11, and fell to $4,250 in
2021-22. (Table SA-5 online)
In 2022-23, the maximum Pell award is $6,895, a $400 increase
largest one-year increase in maximum Pell since 2009-10, before
OTHER SOURCES OF GRANT AID
Between 2011-12 and 2021-22, institutional grant aid for
undergraduate students increased by 53% ($20.9 billion in
Between 2011-12 and 2021-22, institutional grant aid for all students
rose by $24.2 billion (in 2021 dollars) reaching a total of $74.4 billion
in 2021-22. Institutional grants accounted for 53% of all grant aid for
ninth consecutive year in 2020-21, to $1,020—an increase of
36% ($270 in 2020 dollars) since 2011-12. In 2020-21, state grant
STUDENT BORROWING
After rapid growth in annual borrowing between 2006-07 and
2011-12, total annual federal loans to undergraduates declined
by 49% and total federal loans to graduate students decreased
In 2021-22, after the 11th consecutive decline in annual education
borrowing, students and parents borrowed $94.7 billion, down from
in 2021-22, from a peak of $6,450 (in 2021 dollars) in 2010-11.
The share of annual federal education loans going to graduate
students (who constitute about 16% of all postsecondary
students) rose from 35% ($28.2 billion out of $80.1 billion in 2021
dollars) in 2006-07 to 48% ($39.0 billion out of $82.0 billion) in
In 2021-22, 443,000 graduate students borrowed through the
The average amount borrowed through the PLUS program was
$8,960 higher than the average unsubsidized loan ($27,930 vs.
Nonfederal education loans fell from about $29 billion (in 2021
dollars) in 2007-08 to $10 billion in 2009-10 and rose to about
STUDENT DEBT
As of March 2022, 33% of borrowers owed less than $10,000 and
21% of borrowers owed between $10,000 and $20,000 in federal
loan debt. These borrowers held 4% and 8% of the outstanding
As of March 2022, 24% of the $1.62 trillion outstanding federal
loan balance was held by borrowers who were 50 and older, up
In 2020-21, 54% of bachelor’s degree recipients from public and
In 2020-21, 51% of bachelor’s degree recipients from public four-
year institutions graduated with federal loans with an average
graduated with federal loans with an average federal debt level
4
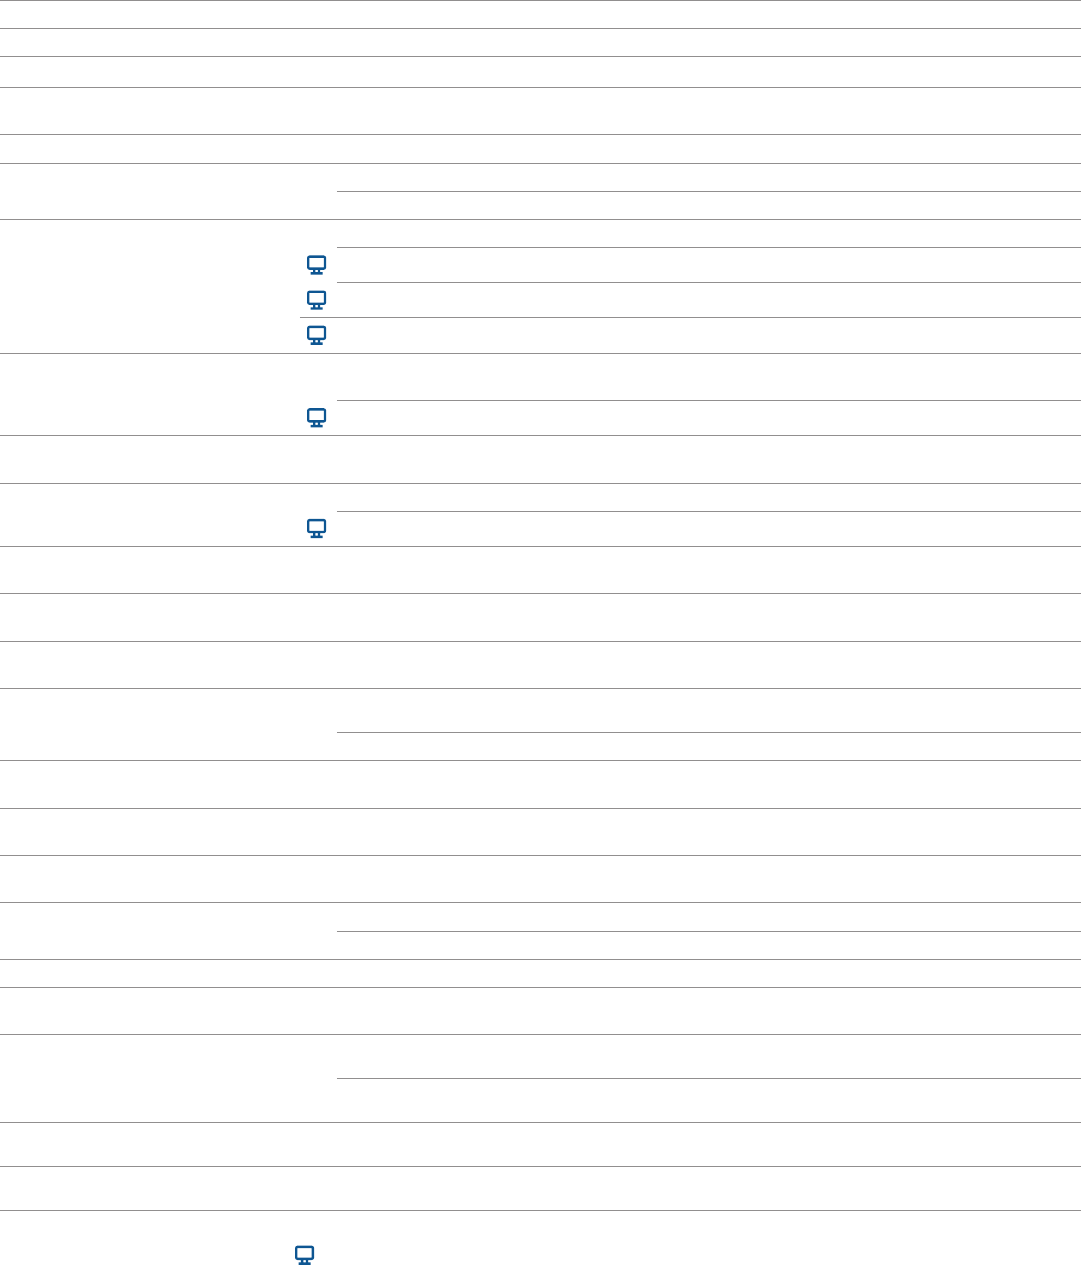
Contents
3
Highlights
7
Introduction
TRENDS IN COLLEGE PRICING
10
2021-22 and 2022-23
Published Charges,
2021-22 and 2022-23
11
Student Budgets, 2022-23
12
Published Tuition and Fees
over Time
13
Published Charges over Time
Ten-Year Percentage Changes in Published Charges, by Decade
14
Tuition and Fees by State:
Public Two-Year
15
Tuition and Fees by State:
Public Four-Year
Percentage Changes
16
Tuition and Fees by State:
Flagship Universities
17
Average Net Price:
Public Two-Year
Two-Year Institutions
18
Average Net Price:
Public Four-Year
19
Average Net Price: Private
Nonprot Four-Year
20
Institutional Revenues:
State and Local Funding
over Time
21
Institutional Revenues:
State and Local Funding
22
Institutional Revenues:
Public Institutions
Institutional Revenues per Student at Public Institutions over Time
23
Institutional Revenues and
Expenditures
24
Family Income
25
Enrollment Patterns over Time
26
Enrollment Patterns over Time,
by Sector
27
Public Enrollment by State
28
Migration
29
Enrollment by Race/Ethnicity
research.collegeboard.org/trends.
5
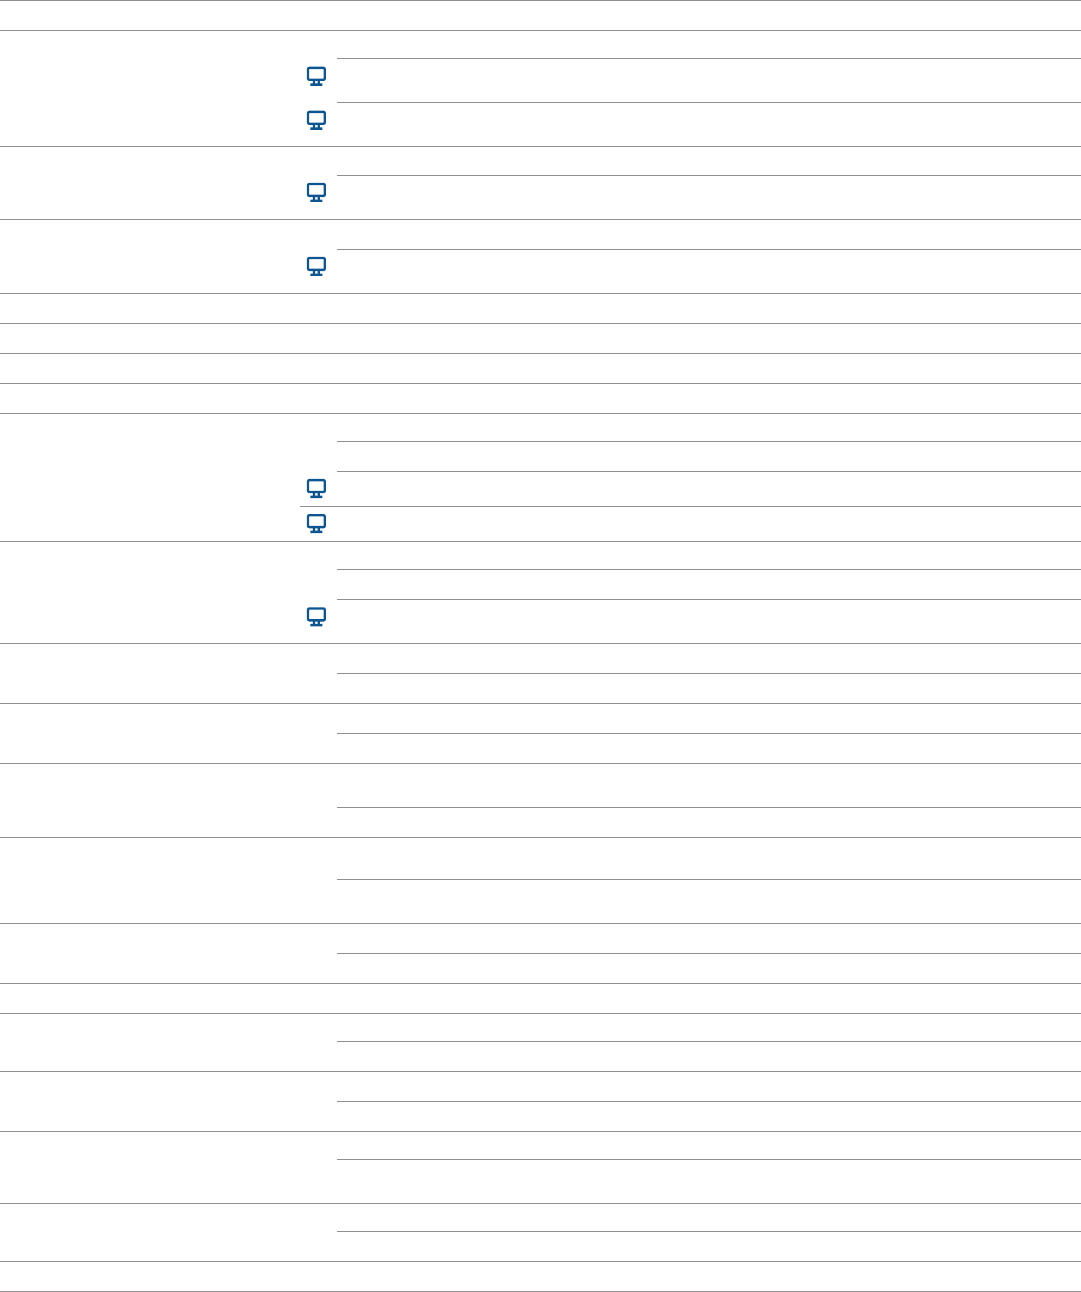
Contents—Continued
TRENDS IN STUDENT AID
31
Total Student Aid
Total Student Aid and Nonfederal Loans in 2021 Dollars over Time
Total Student Aid and Nonfederal Loans in 2021 Dollars over Time: All Students,
Undergraduate Students, and Graduate Students
Total Student Aid and Nonfederal Loans in Current Dollars over Time: All Students,
Undergraduate Students, and Graduate Students
32
Aid per Student
Average Aid per Student over Time
Average Aid per Student over Time: All Students, Undergraduate Students,
and Graduate Students
33
Grants, Loans, and Other Aid
Composition of Total Aid and Nonfederal Loans over Time
Total Aid and Nonfederal Loans in Current and Constant Dollars over Time: All Students,
Undergraduate Students, and Graduate Students
34
Total Undergraduate Student Aid
Total Undergraduate Student Aid by Source and Type over Time
35
Total Graduate Student Aid
Total Graduate Student Aid by Source and Type over Time
36
Sources of Grant Aid
Total Grant Aid by Source over Time
37
Types of Loans
38
Federal Aid
39
Federal Loans: Annual
Borrowing
Undergraduate Students, and Graduate Students
40
Federal Loans: Borrowing and
Balances
41
Federal Loans: Outstanding
Debt by Age
42
Federal Loans: Outstanding
Debt by Repayment Plan and
Repayment Status
by Repayment Plan over Time
43
Cumulative Debt: Bachelor’s
Degree Recipients
Institutions over Time
Average Cumulative Debt Per Borrower by Loan Type Among Bachelor’s Degree
44
Pell Grants
45
Pell Grants
46
Pell Grants
Distribution of Pell Grant Recipients by Age, 2020-21
47
State Grants
Need-Based and Non-Need Based State Grants per Undergraduate Student over Time
Percentage of State Grant Aid Based on Need by State, 2020-21
48
State Grants
State Grant Aid per Undergraduate Student by State, 2020-21
State, 2020-21
49
Instituitonal Grants
50
Notes and Sources
6

Introduction
experienced declines in enrollment.
1
In 2022-23, we continue to see
historically low increases in published tuition and fees in the public
sectors and moderate increases in published tuition and fees in the
published tuition and fees in all three major higher education sectors
declined year-over-year in both 2021-22 and 2022-23.
FAMILY INCOME, TUITION, STUDENT AID AND
NET PRICES
The latest income data from the U.S. Census Bureau show that the
median household income in 2021 was about the same as that in 2020,
after declining by 2.9% between 2019 and 2020.
2
In the last 30 years,
income inequality grew as the average income increased by 64% for
demographic characteristics. In 2021, median incomes for Black and
Hispanic families were about 60% of the median for white families
and the median income for families with at least one four-year college
graduate was more than double the median for families headed by a
Recognizing the struggles students and families face in paying for
college, especially during a pandemic, many colleges and universities
did not raise tuition for the 2020-21 and 2021-22 academic years.
As a result, the tuition increases during those two years were among
the lowest in recent decades. In 2022-23, more institutions raised
tuition and fees than in the previous two years, although the increases
in average tuition and fees at public sectors are still low by historical
standards. Compared to 2021-22, the average 2022-23 sticker tuition
and fees are 1.6% higher for public two-year in-district students,
1.8% higher for public four-year in-state students, and 3.5% higher
in all three sectors between 2021-22 and 2022-23. (Table CP-2)
Changes in sticker prices tend to garner the most media attention.
However, it is important to note that the majority of undergraduate
students do not pay the full sticker price. Grant aid does not need
to be repaid and helps lower the actual prices that students and
families pay. Grant aid comes from a variety of sources including
the federal and state governments, colleges and universities, and
employer and other private sources. In 2021-22, an estimated
$140.6 billion in grant aid was awarded to undergraduate and
graduate students. Of that total, 26% came from the federal
gov
ernment, 9% came from the state governments, 53% came
from colleges and universities, and the remaining 12% came from
Using Trends sticker price data and grant aid data from the
full-time students at public two-year colleges have been receiving
enough grant aid on average to cover their tuition and fees. In
institutions have been declining in recent years.
In addition to grant aid, students and families also received loans
undergraduate and graduate students received $82 billion in federal
loans, $1.1 billion in federal Work-Study, and an estimated $10.8
FEDERAL HIGHER EDUCATION INITIATIVES
At the beginning of the pandemic in March 2020, the federal
government suspended federal student loan payments, ended
collections on defaulted federal student loans, and suspended
interest accrual on all federal student loans through September
provisions through December 31, 2022.
3
On August 24, 2022, the Biden Administration announced a plan
that would provide one-time student debt relief targeted at low- and
middle-income families. Under this plan, Pell recipients can receive
up to $20,000 and non-Pell recipients can receive up to $10,000 in
federal debt relief. To qualify for this relief, borrowers need to have
incomes of less than $125,000 (or $250,000 for households).
4
While
for debt relief are not available,
5
(about a third) of the current 45 million federal loan borrowers have
average debt levels of under $10,000 and another 9.3 million (21%)
have debt levels of between $10,000 and $20,000.
In addition to student loan payment suspension, the federal
education institutions, and students during the pandemic. The three
$76.2 billion.
6
as grant aid to students. In last year’s report, we showed that, on
institutions with higher shares of Pell recipients received more funding
per student than those with lower shares of Pell recipients. (Trends in
College Pricing and Student Aid 2021
https://www.studentclearinghouse.org/blog/fall-2021-undergraduate-
https://research.
collegeboard.org
https://www.census.gov/newsroom/press-releases/2022/income-poverty-
releases/2021/income-poverty-health-insurance-coverage.html
estimates that the plan will cost an average of
$30 billion per year over the next decade.
7

While there is evidence that Covid-19 emergency aid improved
grades and relieved stress,
7
it is still too early to understand the full
debt were both declining prior to the pandemic, and this downward
trend continues. In 2021-22, total annual federal borrowing declined
for the 11th consecutive year to $82.0 billion, from a peak of $132.0
billion (in 2021 dollars) in 2010-11. The average amount of annual
this period, from a peak of $6,450 (in 2021 dollars) in 2010-11 to
households, have been declining since the expansion of the program
during the Great Recession of 2008. In 2021-22, $25.9 billion in Pell
Grant expenditures was awarded to 6.1 million recipients, down from
its peak of $44.3 billion (in 2021 dollars) in 2010-11 and 9.4 million
recipients in 2011-12. The average Pell Grant per recipient has been
Table SA-5 online)
a $400 (6%) increase from the previous year before adjusting for
largest one-year increase in maximum Pell before adjusting for
passed on December 27, 2020 and will be fully implemented by
2024-25. This Act will expand access to Pell Grants to more students
and link eligibility to family size and federal poverty level.
8
ENROLLMENT
enrollment data. The National Student Clearinghouse reported
another year of enrollment declines in fall 2021. The fall 2020
in this year’s and last year’s Trends
National Student Clearinghouse that total postsecondary enrollment
declined in 2020.
9
However, enrollment changes were uneven across
enrollment levels, sectors, states, and demographic groups. Between
2019 and 2020, total undergraduate enrollment declined by 698,000
and graduate enrollment increased by 67,000. Across sectors, the
public two-year sector saw the largest decline in enrollment—581,000
At the state level, nine states experienced increases in postsecondary
enrollment in 2020 compared to 2019 at public four-year colleges,
while all but one state experienced declines in enrollment at public
tw
o-year colleges. (Trends in College Pricing and Student Aid 2021,
While the enrollment numbers we present in this report are descriptive
in nature, a recent study shows similar results after taking into account
pre-pandemic trends and student demographic shifts. The updated
among students entering public two-year colleges in fall 2021.
10
revenues with net tuition revenue being the largest revenue source
11
WHAT IS NEW IN THIS YEAR’S REPORT
Enrollment by Race/Ethnicity
undergraduate students by race/ethnicity over time. Between fall 2010
and fall 2020, the shares of undergraduates who were Asian, Hispanic,
or two or more races increased while the shares of undergraduates
who were Black, White, or Native students declined. The increase in
the share of undergraduate students who were Hispanic is particularly
large — from 14.5% in fall 2010 to 21.9% in fall 2020. This is related
to the demographic shift in high school graduates as the share of all
public high school graduates in the United States who are Hispanic
increased from 17.5% to 25.3% during the same period.
12
Student Debt by Loan Type
In this year’s report, we examine the average cumulative debt per
borrower by loan type among bachelor’s degree recipients. Our
analysis of the latest data from the College Board’s Annual Survey
of Colleges shows that in 2020-21, 54% of bachelor’s degree
year institution borrowed an average of $29,100 per borrower.
52% of bachelor’s degree recipients borrowed federal loans for
their undergraduate study with an average federal loan debt level of
provides additional insight into student borrowing patterns by sector.
Ination Adjustment
We provide much of our data in constant dollars, adjusting values for
changes in the annual Consumer Price Index (CPI). Since the 2022
annual CPI is not yet available, we use the change in the CPI from
aid-improved-grades-relieved-stress
announcements/2021-06-11/beginning-phased-implementation-fafsa-
Digest of Education Statistics, Tables 333.10 and 333.50.
Knocking at the
College Door, 10
th
8

TRENDS IN HIGHER EDUCATION SERIES
Trends in
College Pricing
2022
10
For detailed data behind the graphs and additional information, please visit: research.collegeboard.org/trends.
Published Charges by Sector and by Carnegie
Classication, 2022-23
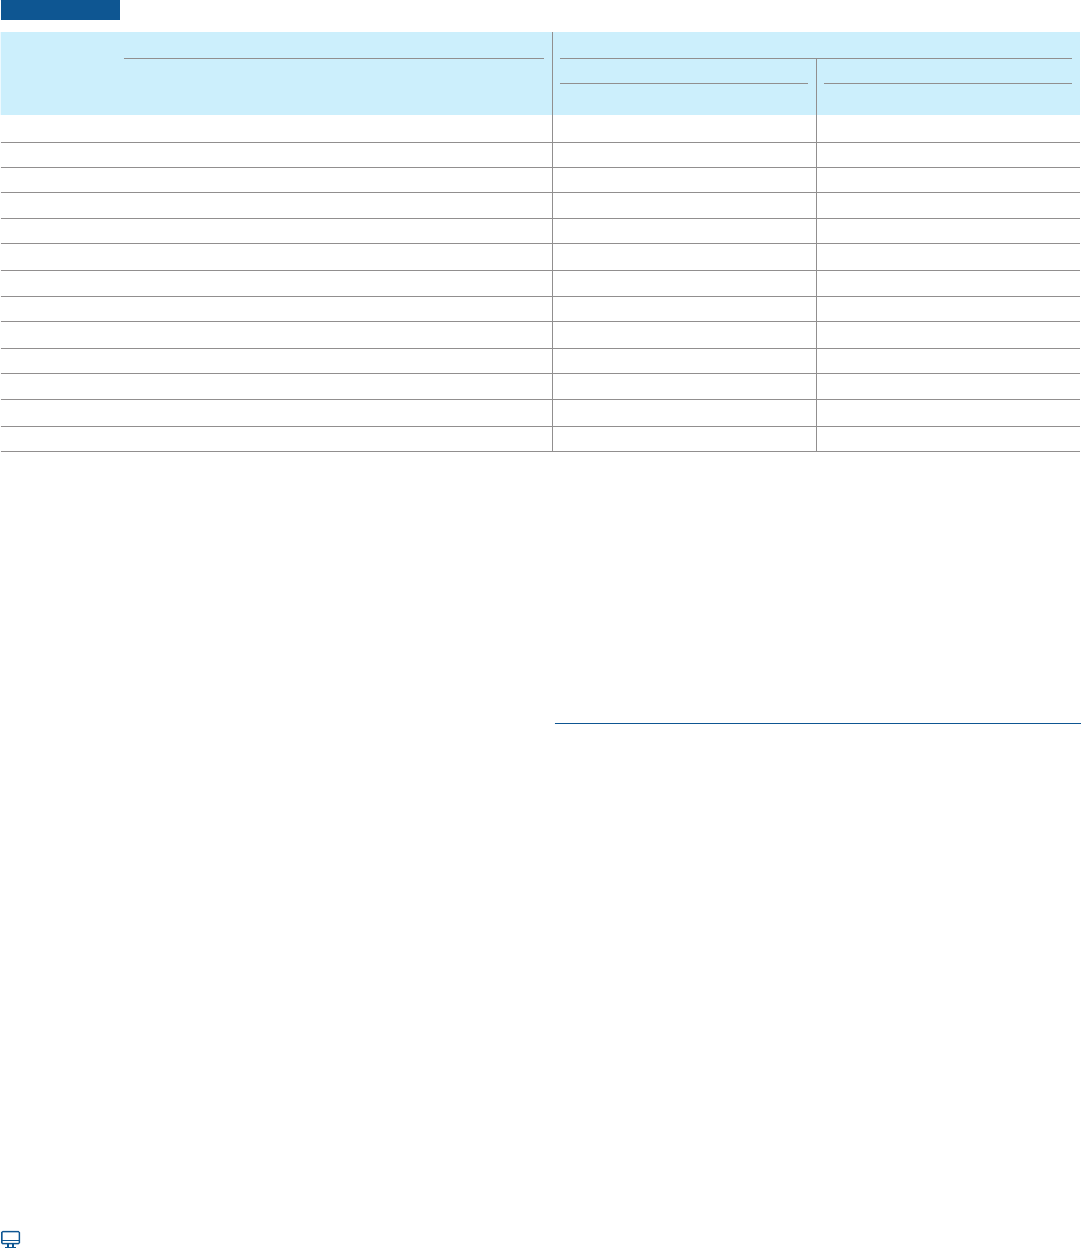
In 2022-23, the average published (sticker) tuition and fee price for full-time in-state students at public
four-year institutions is $10,940, $190 (1.8% before adjusting for ination) higher than it was in 2021-22.
TABLE CP-1 Average Published Charges (Enrollment-Weighted) for Full-Time Undergraduates, 2021-22 and 2022-23
Sector Carnegie Classication
Public
Two-Year
In-District
Public
Four-Year
In-State
Public
Four-Year
Out-of-State
Private
Nonprot
Four-Year For-Prot
Public Four-Year Private Nonprot Four-Year
Doctoral Master’s Bachelor’s Doctoral Master’s Bachelor’s
Tuition and Fees
2022-23 $3,860 $10,940 $28,240 $39,400 — $11,860 $9,150 $9,110 $47,500 $30,650 $39,570
2021-22 $3,800 $10,750 $27,620 $38,070 $15,710 $11,630 $9,010 $8,990 $45,830 $29,660 $38,270
$ Change $60 $190 $620 $1,330 — $230 $140 $120 $1,670 $990 $1,300
% Change 1.6% 1.8% 2.2% 3.5% — 2.0% 1.6% 1.3% 3.6% 3.3% 3.4%
Room and Board
2022-23 $9,610 $12,310 $12,310 $14,030 — $12,880 $11,310 $11,390 $16,000 $13,180 $13,020
2021-22 $9,330 $11,950 $11,950 $13,620 — $12,500 $10,980 $11,060 $15,530 $12,800 $12,640
Tuition and Fees and Room and Board
2022-23 $13,470 $23,250 $40,550 $53,430 — $24,740 $20,460 $20,500 $63,500 $43,830 $52,590
2021-22 $13,130 $22,700 $39,570 $51,690 — $24,130 $19,990 $20,050 $61,360 $42,460 $50,910
Percentage of Undergraduates Enrolled Full Time
Fall 2020 35% 80% 82% 68% 83% 75% 53% 87% 75% 87%
NOTE: Prices in Table CP-1 are not adjusted for ination. Tuition prices reported for 2021-22 have been revised and may dier from those reported in Trends in
College Pricing and Student Aid 2021. The latest tuition and fee estimate available for the for-prot sector is for 2021-22. Carnegie groupings are based on 2018
Carnegie classication.
SOURCE: College Board, Annual Survey of Colleges; NCES, IPEDS Fall 2020 Enrollment data and IPEDS 2021 Institutional Characteristics data.
Enrollment-weighted tuition values represent the price charged by each institution weighted by the number of full-time undergraduate students enrolled in fall 2020,
the latest year for which enrollment data are available. Public four-year in-state charges are weighted by total fall 2020 full-time undergraduate enrollment in each
institution, including both in-state students and out-of-state students. Out-of-state tuition and fees are computed by adding the average in-state price to the out-of-
state premium weighted by the number of full-time out-of-state undergraduate students enrolled at each institution. Room and board charges for 2021-22 and 2022-23
are calculated by applying the average one-year percent changes among institutions that reported data in both years to the previous year’s sector averages. In Trends
in College Pricing 2019 and earlier editions, room and board charges were weighted by the number of undergraduate students residing on campus for four-year
institutions and by the number of commuter students for public two-year institutions.
In 2022-23, the average published tuition and fee price for
full-time in-district students at public two-year institutions is
$3,860, $60 (1.6% before adjusting for ination) higher than it
was in 2021-22.
In 2022-23, the average published tuition and fee price for full-time
students at private nonprot four-year institutions is $39,400,
$1,330 (3.5% before adjusting for ination) higher than it was
in 2021-22.
In fall 2020, 35% of all undergraduate students at the public
two-year sector were enrolled full time, compared with about
80% at public four-year and private nonprot four-year sectors.
Within public four-year and private nonprot four-year sectors,
doctoral institutions have higher prices than master’s and
bachelor’s institutions.
ALSO IMPORTANT:
The prices shown in Table CP-1 are for full-time students.
Prices for part-time students are typically less than those for
full-time students.
The prices shown in Table CP-1 are for one academic year. The
total price of a college education depends on how long a student
is enrolled before completing a degree—frequently more than
four years for a bachelor’s degree and more than two years for
an associate degree.
11
For detailed data behind the graphs and additional information, please visit: research.collegeboard.org/trends.
Student Budgets, 2022-23
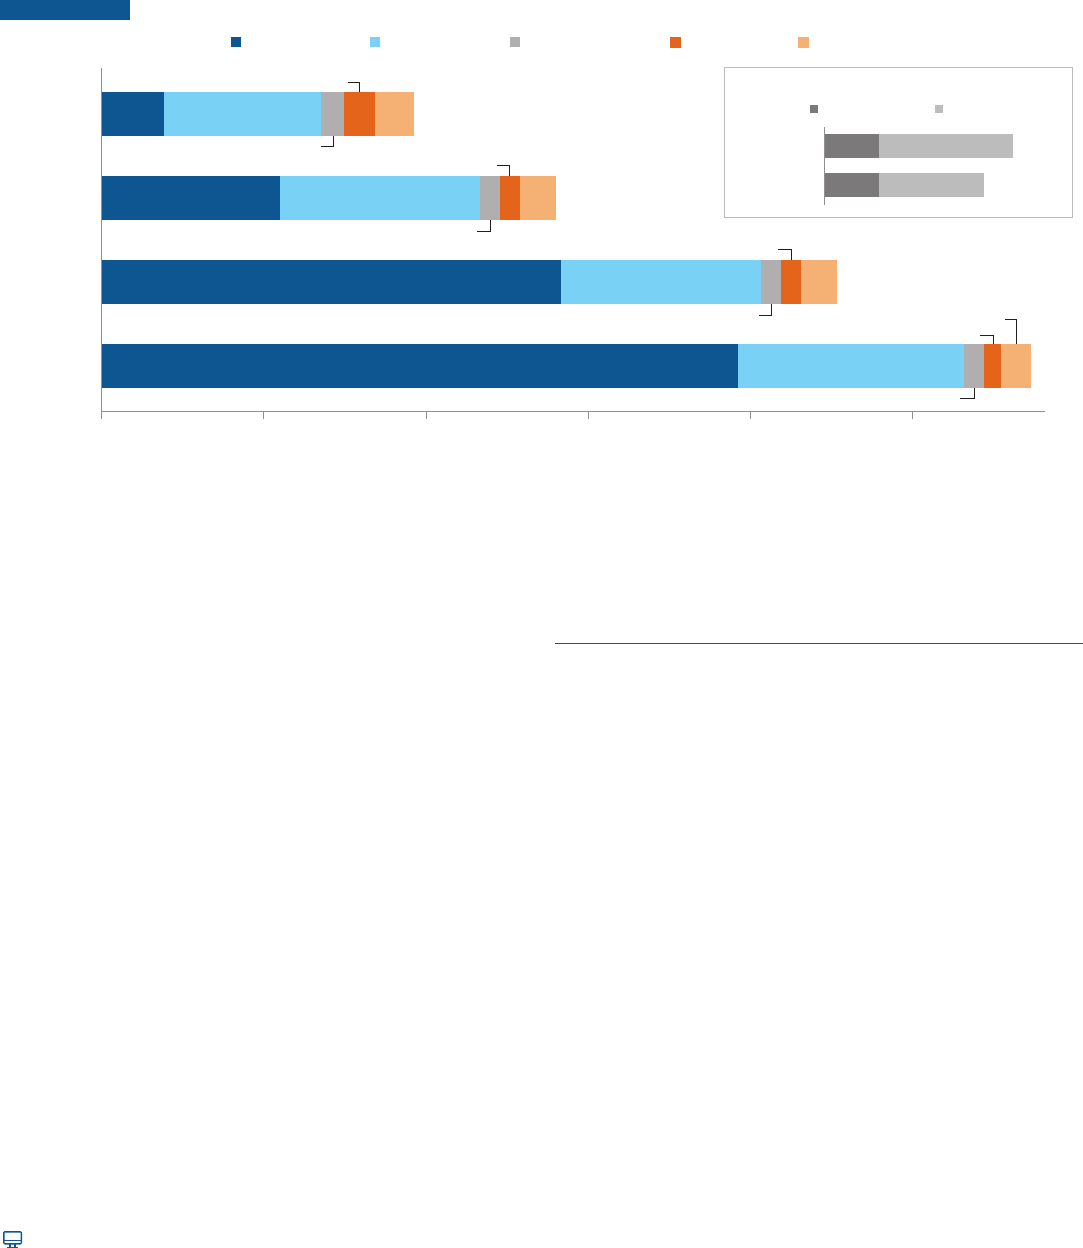
In 2022-23, average budgets for full-time undergraduate students range from $19,230 for public two-year
in-district students and $27,940 for public four-year in-state students to $45,240 for public four-year
out-of-state students and $57,570 for private nonprot four-year students.
FIGURE CP-1 Average Estimated Full-Time Undergraduate Budgets (Enrollment-Weighted) by Sector, 2022-23
$0 $10,000 $20,000 $30,000 $40,000 $50,000
Other ExpensesTransportationBooks and SuppliesRoom and BoardTuition and Fees
Undergraduate Budget
$39,400
$1,070
$1,830
$1,240
$14,030 $57,570
Private Nonprofit
Four-Year
On-Campus
$28,240
$12,310
$1,250
$1,240
$2,200 $27,940
$12,310
$1,250
$1,240
$2,200 $45,240
Public Four-Year
Out-of-State
On-Campus
$10,940
Public Four-Year
In-State
On-Campus
$3,860 $9,610
$2,430 $19,230
$1,870
$1,460
Public Two-Year
In-District
Commuter
$340
$340
$900
$1,120
$1,240
$1,460
Four-Year
Public Two-Year
Books and Supplies
Course Materials Other Supplies
NOTE: Expense categories are based on institutional budgets for students as reported in the College Board’s Annual Survey of Colleges. Figures for tuition and fees
and room and board mirror those reported in Table CP-1. Data for books and supplies, transportation, and other expenses are projected and reect the average
amounts allotted in determining the total cost of attendance and do not necessarily reect actual student expenditures. Books and supplies may include course
materials such as hardcopy textbooks, online textbooks, textbook rentals, and other supplies such as a personal computer used for study.
SOURCE: College Board, Annual Survey of Colleges; NCES, IPEDS Fall 2020 Enrollment data; Student Watch and Student Monitor.
Student budgets are constructed by institutional nancial aid
oces. These budgets form the basis for determining the total
cost of attendance, which can aect the amount of nancial aid
for which students are eligible.
Room and board and other components of student budgets vary
less across sectors than tuition and fees. As a result, while the
average published in-district tuition and fee price at public
two-year institutions is 35% of the in-state price at public
four-year colleges, the total public two-year in-district student
budget is 69% of the public four-year in-state student budget
($19,230 vs. $27,940).
The average in-state published tuition and fee price at public
four-year institutions is 28% of the average price at private
nonprot four-year institutions; the average student budget is
about half the amount ($27,940 vs. $57,570).
ALSO IMPORTANT:
In the last decade, average student spending on college
textbooks and digital course materials declined by between 44%
and 48%. (Student Watch and Student Monitor: 2022 Reports)
12
research.collegeboard.org/trends.
Published Tuition and Fees over Time
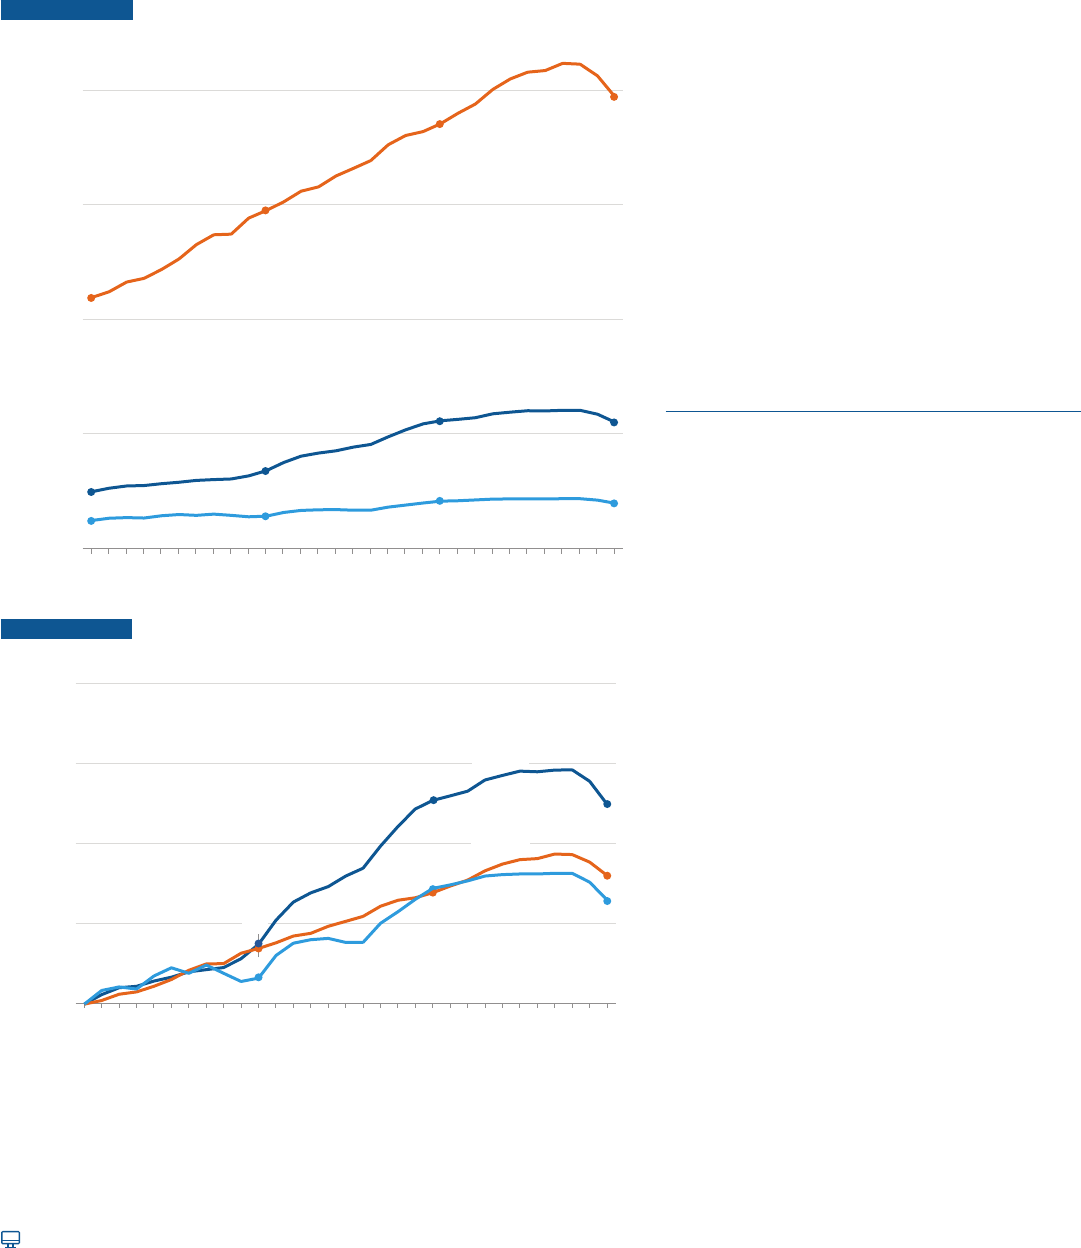
Between 1992-93 and 2022-23, the average tuition and fees increased from $2,340 to $3,860 at public
FIGURE CP-2
1992-93 to 2022-23
$21,860
$29,460
$37,050
$39,400
$30,000
$40,000
Published Tuition and Fees in 2022 Dollars
Private
Nonprot
Four-Year
$20,000
Public
Four-Year
$10,940
$11,060
$10,000
$6,690
Public
$4,870
$4,030
Two-Year
$3,860
$2,720
$2,340
$0
92-93 97-98 02-03 07-08 12-13 17-18 22-2
3
FIGURE CP-3
1992-93 to 2022-23 (1992-93 = 1.0)
3.0
Public
2.5
Four-Year
1.69
2.27
2.25
1.80
1.65
1.72
1.0
1.5
2.0
Inflation-Adjusted Published Tuition and Fees
Relative to 1992-93
Private
Nonprot
Four-Year
Public
Two-Year
1.35
1.16
1.37
92-93 97-98 02-03 07-08 12-13 17-18
22-23
the public four-year sector in 2022-23 is 2.25 times as high as it was in 1992-93, after adjusting
charges for public two-year institutions and in-state charges for public four-year institutions.
In 2022-23, the average published tuition and fee
price at public two-year colleges is 35% of the
was 48% in 1992-93.
In 2022-23, the average published tuition and fee
3.6 times as high as the average price at public
1992-93.
In 2022-23, the average published tuition and fee
price is 1.65 times as high as it was 30 years ago
at public two-year colleges, 2.25 times as high as
it was 30 years ago at public four-year institutions,
and 1.8 times as high as it was 30 years ago at
ALSO IMPORTANT:
The increases in the net prices that students actually
pay, after taking grant aid into consideration, have
been smaller over the long term than increases in
CP-10 for details on estimated average net prices
over time.
Over the 30-year period from 1991 to 2021, median
family income in the United States increased by
27% (from $69,915 to $88,590), after adjusting for
13
For detailed data behind the graphs and additional information, please visit: research.collegeboard.org/trends.
Published Charges over Time
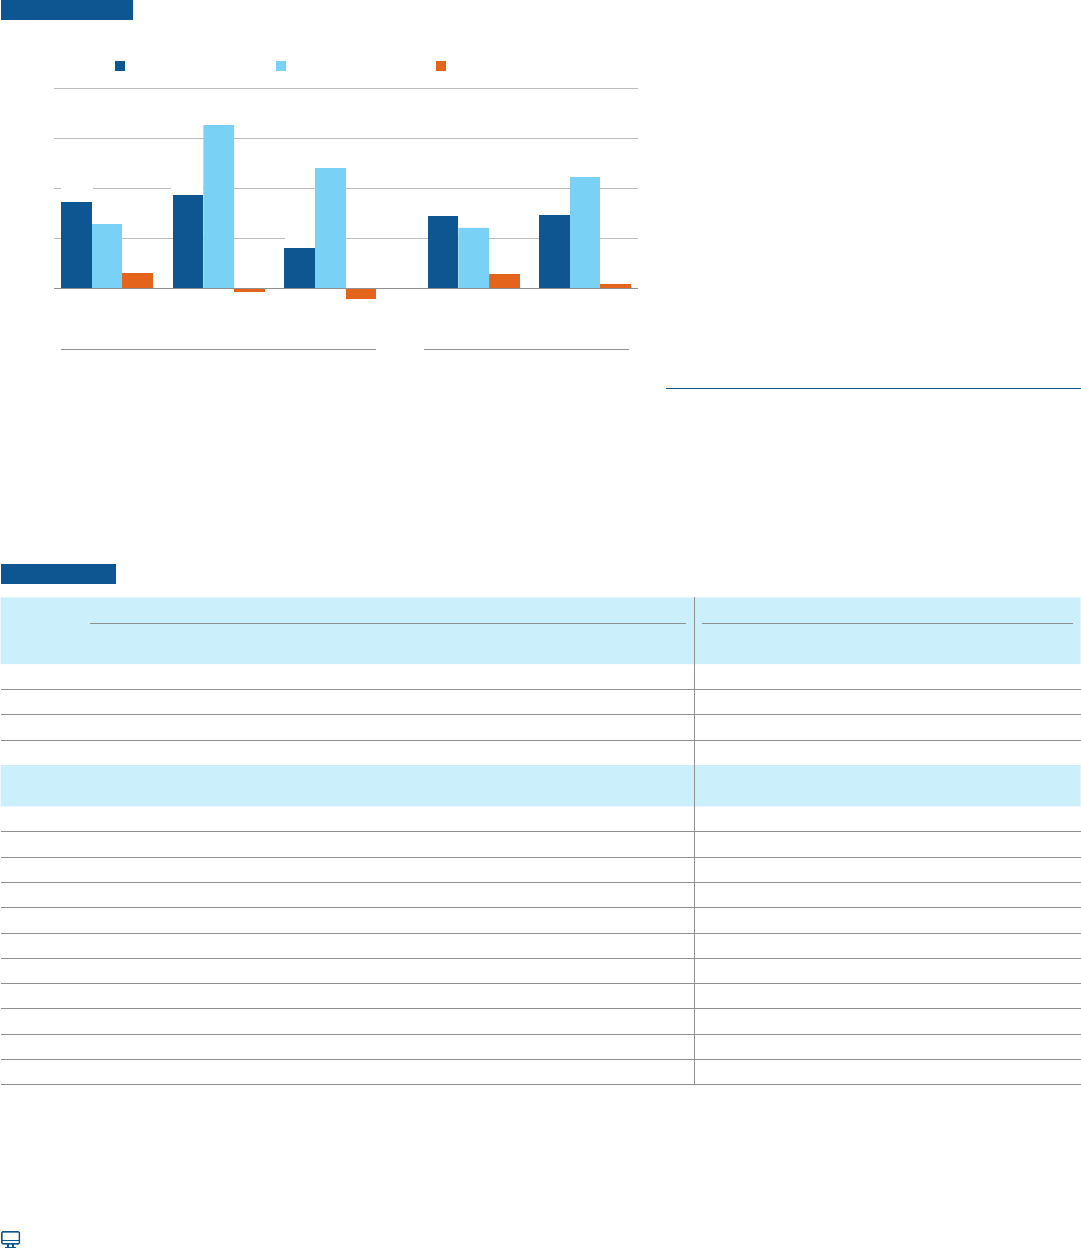
After adjusting for ination, the average published tuition and fees in all three sectors remained unchanged
in 2020-21 and declined in 2021-22 and 2022-23. The ination rate was 1.2% in 2020, 4.7% in 2021, and
8.3% in the rst eight months of 2022.
FIGURE CP-4 Ten-Year Percentage Changes in Ination-Adjusted Published
Prices by Decade, 1992-93 to 2022-23
Tuition and Fees
and Room and Board
Public
Four-Year
Private Nonprofit
Four-Year
Tuition and Fees
Public
Two-Year
Public
Four-Year
Private Nonprofit
Four-Year
2012-13 to 2022-232002-03 to 2012-131992-93 to 2002-03
29%
29%
24%
44%
26%
35%
6%
37%
65%
-1%
48%
-4%
6%
2%
0%
20%
40%
60%
80%
10-Year Percentage Change
16%
NOTE: Each bar in Figure CP-4 shows the percentage change in published prices in ination-
adjusted dollars over a 10-year period. For example, from 2012-13 to 2022-23, average published
tuition and fees at private nonprot four-year colleges increased by 6% beyond increases in the
Consumer Price Index. Average tuition and fee prices reect in-district charges for public
two-year institutions and in-state charges for public four-year institutions.
SOURCE: College Board, Annual Survey of Colleges; NCES, IPEDS Fall Enrollment data.
Between 2012-13 and 2022-23, published in-state
tuition and fees at public four-year institutions
declined by -1% after adjusting for ination,
compared with increases of 37% between
1992-93 and 2002-03 and 65% between
2002-03 and 2012-13.
Between 2012-13 and 2022-23, published in-state
tuition and fees in the public four-year sector
declined by $120 in 2022 dollars, compared with
increases of $1,820 between 1992-93 and 2002-03
and $4,370 between 2002-03 and 2012-13.
Between 2012-13 and 2022-23, total tuition, fees,
room and board increased by 2% at public four-year
and by 6% at private nonprot four-year institutions,
after adjusting for ination.
ALSO IMPORTANT:
The price increases reported in Table CP-2 are
adjusted for ination and are smaller than the
unadjusted price changes in Table CP-1.
TABLE CP-2 Average Tuition and Fees and Room and Board (Enrollment-Weighted) in 2022 Dollars, 1992-93 to 2022-23, Selected Years
Ac
ademic
Year
Tuition and Fees in 2022 Dollars Tuition and Fees and Room and Board in 2022 Dollars
Private Nonprot
Four-Year
10-Year
$ Change
Public
Four-Year
10-Year
$ Change
Public
Two-Year
10-Year
$ Change
Private Nonprot
Four-Year
10-Year
$ Change
Public
Four-Year
10-Year
$ Change
1992-93 $21,860 $4,870 $2,340 $31,440 $12,190
2002-03 $29,460 $7,600 $6,690 $1,820 $2,720 $380 $40,570 $9,130 $15,770 $3,580
2012-13 $37,050 $7,590 $11,060 $4,370 $4,030 $1,310 $50,420 $9,850 $22,780 $7,010
2022-23 $39,400 $2,350 $10,940 -$120 $3,860 -$170 $53,430 $3,010 $23,250 $470
Academic
Year
Private Nonprot
Four-Year
One-Year
%Change
Public
Four-Year
One-Year
%Change
Public
Two-Year
One-Year
%Change
Private Nonprot
Four-Year
One-Year
%Change
Public
Four-Year
One-Year
%Change
2012-13 $37,050 $11,060 $4,030 $50,420 $22,780
2013-14 $37,960 2.5% $11,200 1.3% $4,080 1.2% $51,600 2.3% $23,150 1.6%
2014-15 $38,780 2.2% $11,340 1.3% $4,140 1.5% $52,620 2.0% $23,470 1.4%
2015-16 $40,040 3.2% $11,680 3.0% $4,210 1.7% $54,330 3.2% $24,230 3.2%
2016-17 $40,960 2.3% $11,820 1.2% $4,230 0.5% $55,450 2.1% $24,640 1.7%
2017-18 $41,560 1.5% $11,950 1.1% $4,240 0.2% $56,270 1.5% $24,890 1.0%
2018-19 $41,700 0.3% $11,930 -0.2% $4,240 0.0% $56,430 0.3% $25,010 0.5%
2019-20
$42,330 1.5% $11,980 0.4% $4,250 0.2% $57,240 1.4% $25,200 0.8%
2020-21 $42,260 -0.2% $11,990 0.1% $4,250 0.0% $57,350 0.2% $25,270 0.3%
2021-22 $41,230 -2.4% $11,640 -2.9% $4,120 -3.1% $55,980 -2.4% $24,580 -2.7%
2022-23 $39,400 -4.4% $10,940 -6.0% $3,860 -6.3% $53,430 -4.6% $23,250 -5.4%
NOTE: Average tuition and fee prices reect in-district charges for public two-year institutions and in-state charges for public four-year institutions.
SOURCE: College Board, Annual Survey of Colleges; NCES, IPEDS Fall Enrollment data.
14
For detailed data behind the graphs and additional information, please visit: research.collegeboard.org/trends.
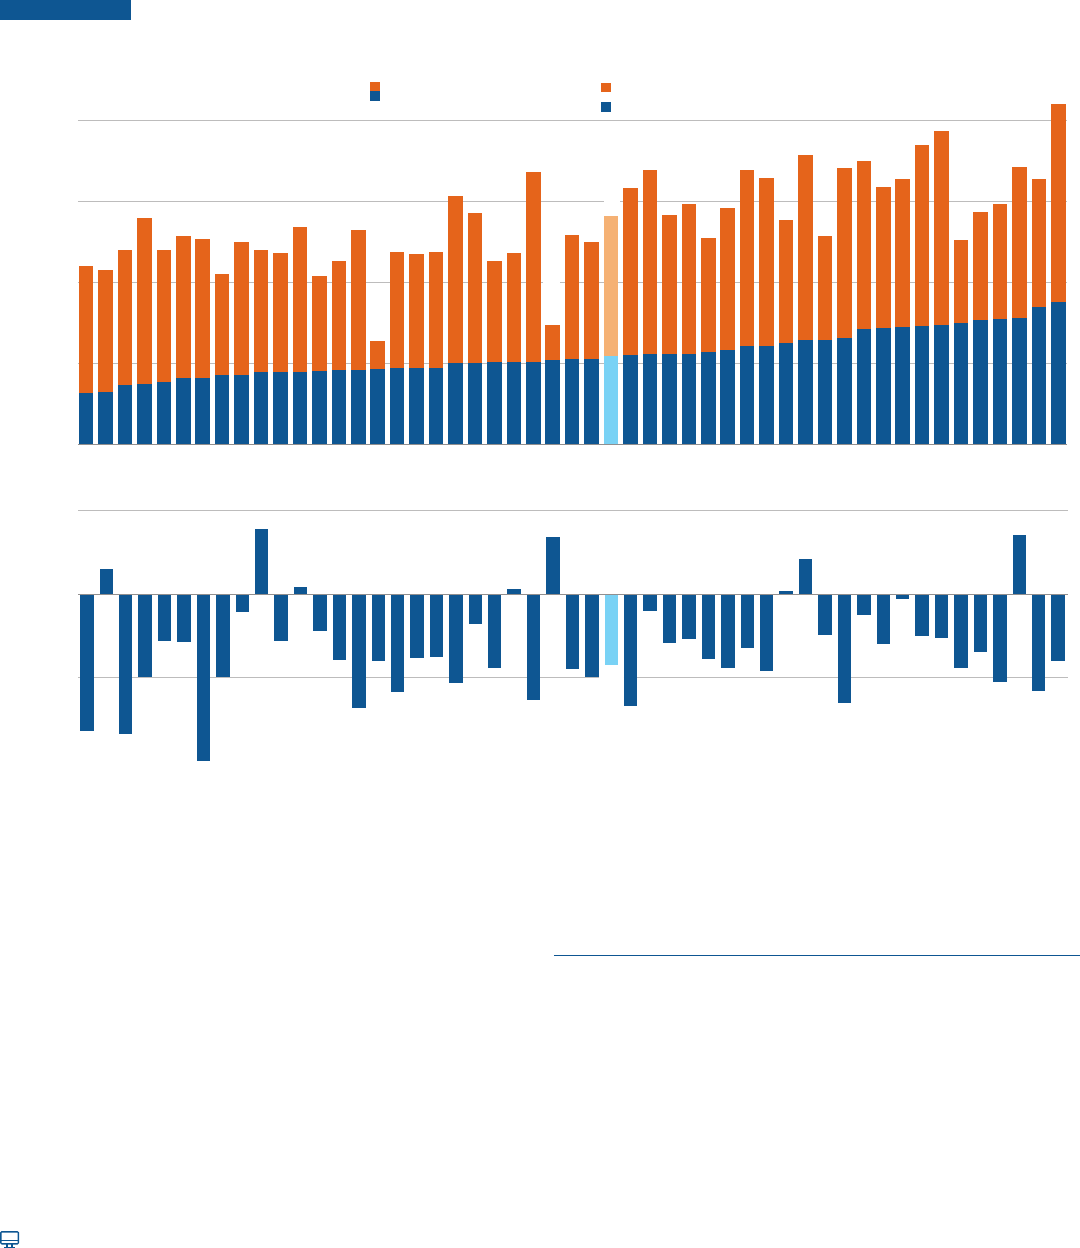
Tuition and Fees by State: Public Two-Year
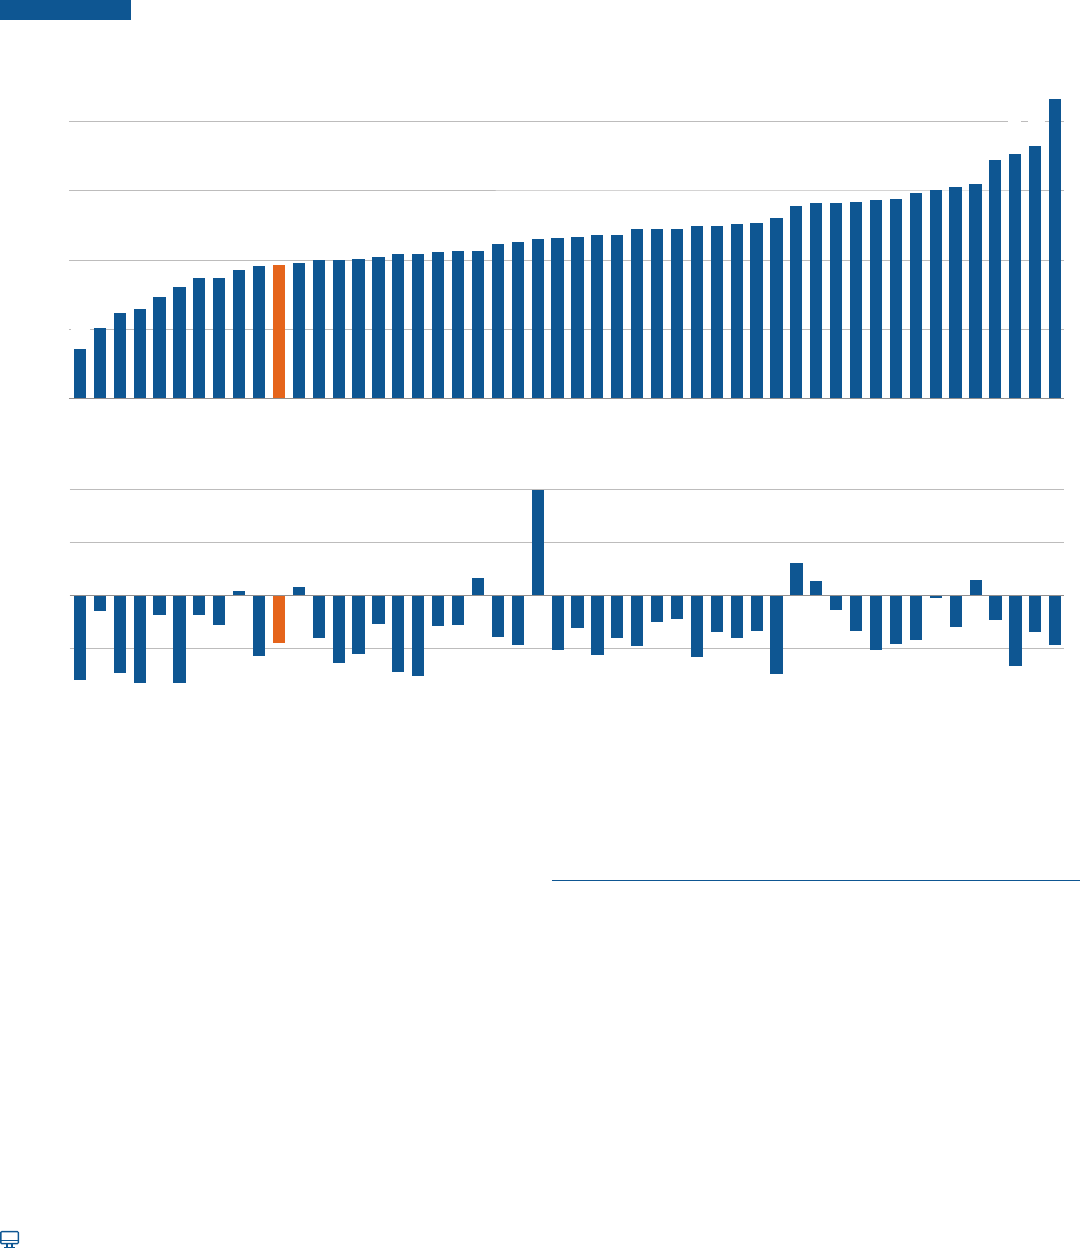
In 2022-23, average published tuition and fees for full-time in-district students at public two-year colleges
range from $1,430 in California and $2,050 in New Mexico to $8,660 in Vermont.
FIGURE CP-5 Average 2022-23 In-District Tuition and Fees at Public Two-Year Institutions and 2017-18 to 2022-23 Five-Year Percentage
Changes in Ination-Adjusted In-District Tuition and Fees, by State
$0
$2,000
$4,000
$6,000
$8,000
5-Year Percentage Change in
Average In-District Tuition and Fees
2022-23 Average In-District Tuition and Fees
$1,430
$2,050
$3,860
$8,660
$7,310
CA
NM
NC
AZ
TX
FL
KS
NE
MS
VA
OH
ND
NJ
KY
OR
MA
NH
SD
VT
ME
US
NV
MT
HI
GA
AR
ID
LA
UT
MI
MO
IL
WV
WY
TN
OK
WI
CT
MD
CO
WA
DE
AL
IN
RI
NY
PA
SC
IA
MN
$7,090
0%
10%
20%
California
New Mexico
North Carolina
Arizona
Texas
Florida
Kansas
Nebraska
Mississippi
Virginia
Ohio
North Dakota
New Jersey
Kentucky
Oregon
Massachusetts
New Hampshire
South Dakota
Vermont
Maine
United States
Nevada
Montana
Hawaii
Georgia
Arkansas
Idaho
Louisiana
Utah
Michigan
Missouri
Illinois
West Virginia
Wyoming
Tennessee
Oklahoma
Wisconsin
Connecticut
Maryland
Colorado
Washington
Delaware
Alabama
Indiana
Rhode Island
New York
Pennsylvania
South Carolina
Iowa
Minnesota
-16%
-9%
20%
-10%
SOURCE: College Board, Annual Survey of Colleges; NCES, IPEDS Fall Enrollment data.
Between 2017-18 and 2022-23, average in-district tuition and fees
at public two-year colleges increased in seven states and declined
in the remaining states, after adjusting for ination.
Between 2017-18 and 2022-23, average in-district tuition and fees
at public two-year colleges declined by more than 10% in 15 states,
after adjusting for ination.
ALSO IMPORTANT:
In California and Florida, tuition at public two-year colleges has
not changed since 2012-13 and 2015-16, respectively, before
adjusting for ination. (Table CP-5 online)
From 2021-22 to 2022-23, the average published two-year
in-district tuition and fees did not increase in eight states,
before adjusting for ination. (Table CP-5 online)
15
For detailed data behind the graphs and additional information, please visit: research.collegeboard.org/trends.
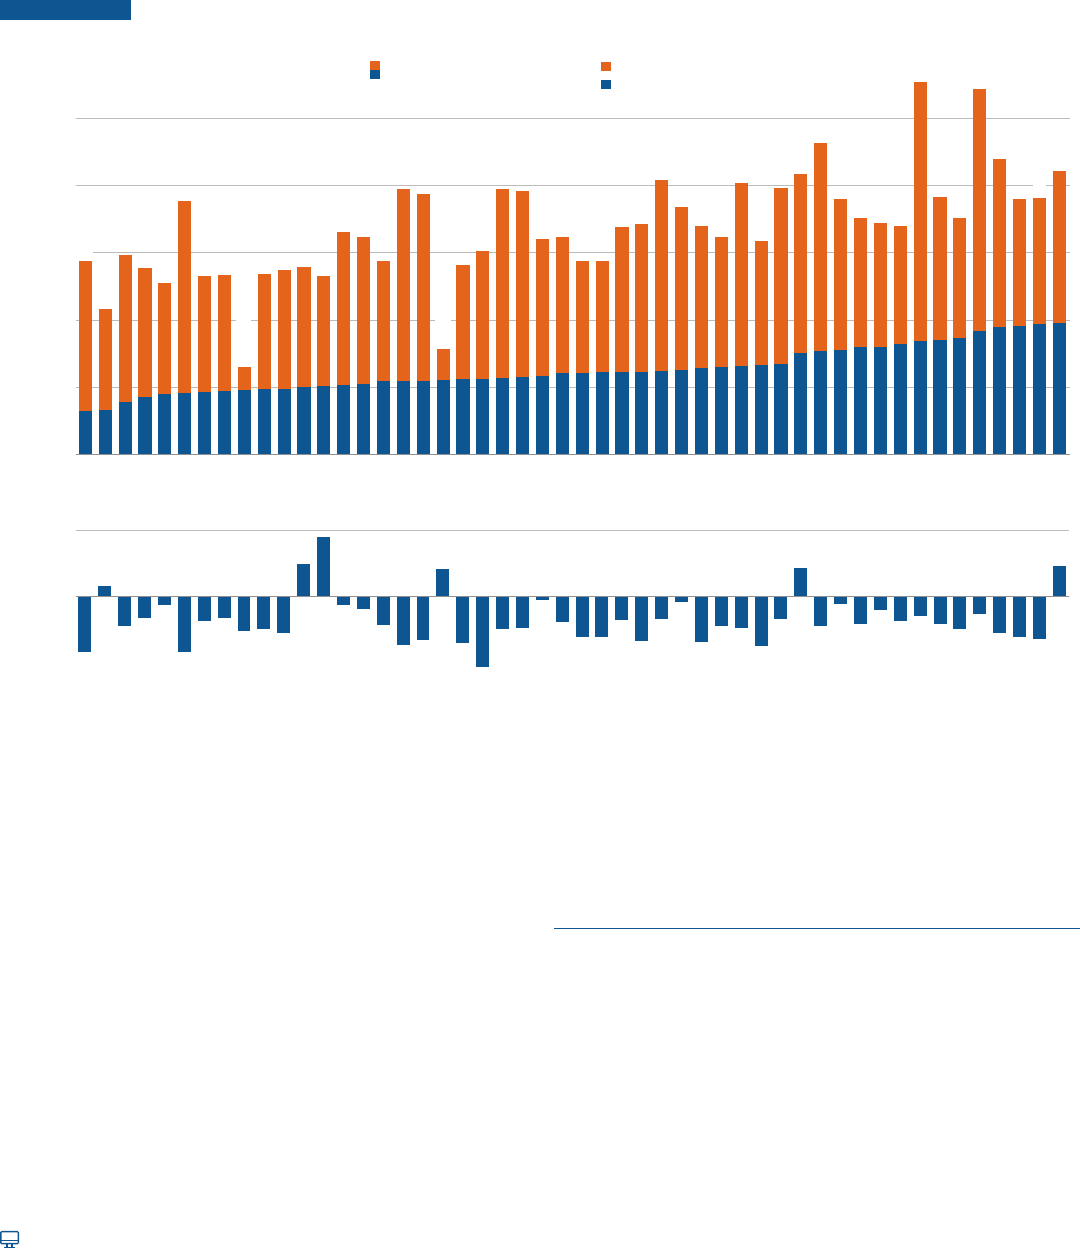
Tuition and Fees by State: Public Four-Year
In 2022-23, average published tuition and fees for full-time in-state students at public four-year institutions
range from $6,370 in Florida and $6,440 in Wyoming to $17,020 in New Hampshire and $17,650 in Vermont.
FIGURE CP-6 Average 2022-23 Tuition and Fees at Public Four-Year Institutions and 2017-18 to 2022-23 Five-Year Percentage Changes in
Ination-Adjusted In-State Tuition and Fees, by State
$22,010
$21,590
$12,830
$14,800
$41,9
80
$32,740
$10,000
$20,000
$30,000
$40,000
$0
5-Year Percentage Change in
Average In-State Tuition and Fees
2022-23 Average Tuition and Fees
In-State Tuition and Fees
Out-of-State Premium
Out-of-State Tuition and Fees
$28,240
$17,650
$17,020
$10,940
$6,370
$6,440
FL
WY
NC
MT
UT
ID
GA
NY
NV
NM
WV
AK
MS
NE
WI
SD
KS
OK
AR
IN
IA
LA
MO
CA
ND
MD
TN
US
HI
WA
TX
ME
KY
AL
CO
AZ
OH
OR
MN
SC
DE
MA
RI
VA
MI
IL
NJ
PA
CT
NH
VT
Florida
Wyoming
North Carolina
Montana
Utah
Idaho
Georgia
New York
Nevada
New Mexico
West Virginia
Alaska
Mississippi
Nebraska
Wisconsin
South Dakota
Kansas
Oklahoma
Arkansas
Indiana
Iowa
Louisiana
Missouri
California
North Dakota
Maryland
Tennessee
United States
Hawaii
Washington
Texas
Maine
Kentucky
Alabama
Colorado
Arizona
Ohio
Oregon
Minnesota
South Carolina
Delaware
Massachusetts
Rhode Island
Virginia
Michigan
Illinois
New Jersey
Pennsylvania
Connecticut
New Hampshire
Vermont
-16%
-17%
-20%
3%
0%
10%
-10%
7%
4%
-8%
SOURCE: College Board, Annual Survey of Colleges; NCES, IPEDS Fall Enrollment data.
Between 2017-18 and 2022-23, average in-state tuition and fees
at public four-year institutions increased in eight states, after
adjusting for ination.
Between 2017-18 and 2022-23, average in-state tuition and fees
at public four-year institutions fell in 42 states and fell by more
than 10% in 12 states, after adjusting for ination.
ALSO IMPORTANT:
A small number of public four-year institutions charge the same
tuition to out-of-state students as to in-state students.
From 2021-22 to 2022-23, the average published four-year
in-state tuition and fees did not increase in nine states, before
adjusting for ination. (Table CP-5 online)
16
For detailed data behind the graphs and additional information, please visit: research.collegeboard.org/trends.
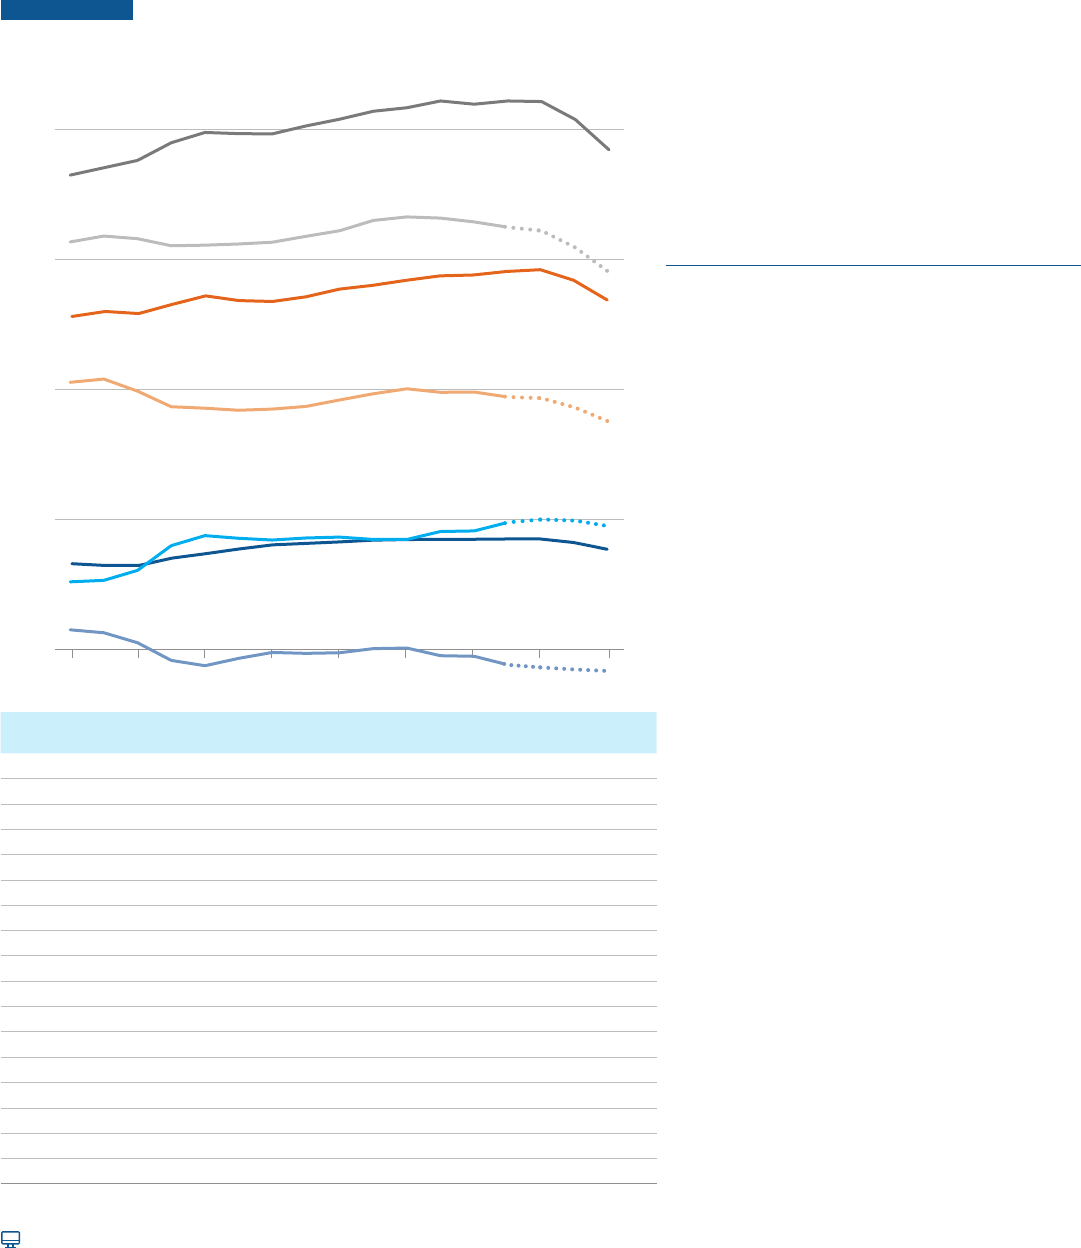
Tuition and Fees by State: Flagship Universities
In 2022-23, published tuition and fees for full-time in-state students at agship universities range from
$6,380 at the University of Florida and $6,440 at the University of Wyoming to $19,290 at Pennsylvania State
University and $19,430 at the University of Connecticut.
FIGURE CP-7 2022-23 Tuition and Fees at Flagship Universities and Five-Year Percentage Changes in Ination-Adjusted In-State Tuition and Fees
$28,660
$55,330
$54,390
$38,100
$42,100
$21,590
5-Year Percentage Change in
In-State Tuition and Fees
$0
$10,000
$20,000
$30,000
$40,000
$50,000
2022-23 Tuition and Fees
In-State Tuition and Fees
Out-of-State Premium
Out-of-State Tuition and Fees
MT
ID
NM
MS
UT
IA
WI
LA
WA
KY
DE
NJ
MI
MA
IL
VA
FL
WY
NC
WV
SD
NE
AR
AK
NM
NY
TX
ND
KS
GA
MD
IN
MO
AL
OK
ME
HI
OH
SC
CO
TN
AZ
OR
CA
MN
RI
VT
NH
PA
CT
$12,940
0%
20%
3%
10%
18%
8%
-15%
-21%
9% 9%
Univ. of MT
Univ. of ID
Univ. of MS
Univ. of UT
Univ. of IA
Univ. of WI-Madison
LA State Univ. & A&M College
Univ. of WA
Univ. of KY
Univ. of DE
Rutgers, State Univ. of NJ
Univ. of MI
Univ. of MA-Amherst
Univ. of IL-Urbana-Champaign
Univ. of VA
Univ. of FL
Univ. of WY
Univ. of NV: Reno
Univ. of NC-Chapel Hill
West VA Univ.
Univ. of SD
Univ. of NE-Lincoln
Univ. of AR
Univ. of AK Fairbanks
Univ. of NM
State Univ. of NY-Buff
alo
Univ. of TX-Austin
Univ. of ND
Univ. of KS
Univ. of GA
Univ. of MD-College Park
IN Univ. Bloomington
Univ. of MO-Columbia
Univ. of AL
Univ. of OK
Univ. of ME
Univ. of HI-Manoa
OH State Univ.-Columbus
Univ. of SC
Univ. of CO-Boulder
Univ. of TN-Knoxville
Univ. of AZ
Univ. of OR
Univ. of CA-Berkeley
Univ. of MN-Twin Cities
Univ. of RI
Univ. of VT
Univ. of NH
Penn State Univ. Park
Univ. of CT
-16% -17%
$6,380
$6,440
$19,290
$19,430
$9,660
$10,780
$16,740
$18,240
$15,570
SOURCE: College Board, Annual Survey of Colleges.
In 2022-23, published tuition and fees for full-time out-of-state
students at agship universities range from $12,940 at the
University of South Dakota and $15,570 at the University of North
Dakota to $54,390 at the University of Virginia and $55,330 at the
University of Michigan.
Public agship universities in 44 states had lower in-state tuition
and fees in 2022-23 than in 2017-18, after adjusting for ination.
ALSO IMPORTANT:
In 2022-23, 11 agship universities did not raise in-state tuition or
mandatory fees over those charged for the 2021-22 academic year,
before adjusting for ination. (Table CP-6 online)
17
For detailed data behind the graphs and additional information, please visit: research.collegeboard.org/trends.
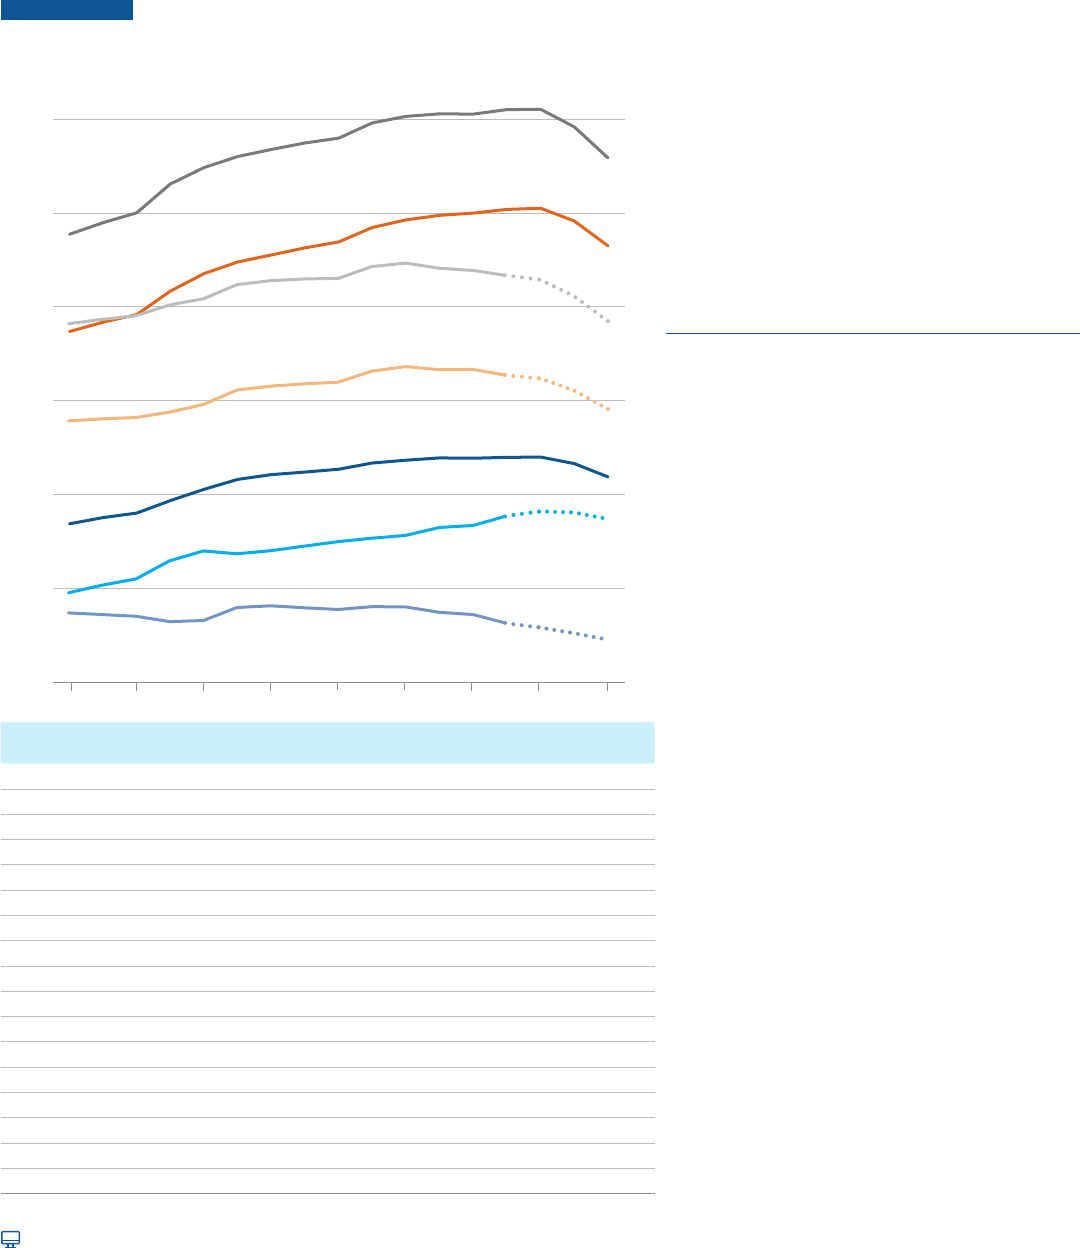
Average Net Price: Public Two-Year
Since 2009-10, rst-time full-time students at public two-year colleges have been receiving enough grant
aid on average to cover their tuition and fees.
FIGURE CP-8 Average Published and Net Prices in 2022 Dollars, First-Time
Full-Time In-District Undergraduate Students at Public Two-Year
Institutions, 2006-07 to 2022-23
$0
$5,000
$10,000
$15,000
$20,000
Published Tuition
and Fees and Room
and Board (TFRB)
Net TFRB
Published Cost
of Attendance (COA)
Net COA
Grant Aid
Published
Tuition and Fees (TF)
Net TF
Public Two-Year
06-07 10-11 12-13 16-17 18-19 22-2308-09 14-15 20-21
Published
TF
Published
TFRB
Published
COA
Grant Aid
per Student Net TF Net TFRB Net COA
06-07 $3,300 $12,830 $18,250 $2,570 $730 $10,260 $15,680
07-08 $3,240 $13,020 $18,530 $2,630 $610 $10,390 $15,900
08-09 $3,240 $12,940 $18,820 $3,020 $220 $9,920 $15,800
09-10 $3,520 $13,290 $19,500 $3,970 -$450 $9,320 $15,530
10-11 $3,690 $13,620 $19,900 $4,350 -$660 $9,270 $15,550
11-12 $3,870 $13,440 $19,850 $4,250 -$380 $9,190 $15,600
12-13 $4,030 $13,410 $19,840 $4,180 -$150 $9,230 $15,660
13-14 $4,080 $13,590 $20,150 $4,260 -$180 $9,330 $15,890
14-15 $4,140 $13,880 $20,410 $4,300 -$160 $9,580 $16,110
15-16 $4,210 $14,030 $20,710 $4,210 $0 $9,820 $16,500
16-17 $4,230 $14,220 $20,850 $4,210 $20 $10,010 $16,640
17-18 $4,240 $14,390 $21,110 $4,510 -$270 $9,880 $16,600
18-19 $4,240 $14,430 $20,990 $4,540 -$300 $9,890 $16,450
19-20 $4,250 $14,570 $21,110 $4,870 -$620 $9,700 $16,240
20-21 $4,250 $14,630 $21,090 $4,980 -$730 $9,650 $16,110
21-22 $4,120 $14,220 $20,390 $4,930 -$810 $9,290
$15,460
22-23 $3,860 $13,470 $19,230 $4,720 -$860 $8,750 $14,510
In 2022-23, rst-time full-time students at public
two-year colleges need to cover an estimated
$8,750 in food and housing after grant aid, in
addition to another $5,760 in allowances for books
and supplies, transportation, and other personal
expenses.
The average net tuition and fee price declined in
this sector from 2006-07 through 2010-11, was
stable between 2012-13 and 2016-17 and has been
declining since.
ALSO IMPORTANT:
Because of changes in the data sources used in
calculating average grant aid per student, numbers
in Figures CP-8, CP-9, and CP-10 are not strictly
comparable with those in Trends in College Pricing
2019 and earlier editions.
The average net prices in Figure CP-8 are calculated
among all rst-time full-time undergraduate students
in the public two-year sector, including those who
did not receive grant aid. In 2019-20, 75% of rst-
time full-time undergraduate students in this sector
received federal, state, or institutional grant aid.
The large increase in average grant aid shown in
Figure CP-8 between 2008-09 and 2010-11 was
primarily a result of increases in Pell Grant funding.
Average Pell Grant aid per rst-time full-time student
in this sector almost doubled in this two-year period.
NOTE: Average net price is calculated as the dierence
between published price from College Board’s Annual
Survey of Colleges and grant aid from IPEDS Student
Financial Aid data. Because the latest year for which grant
aid data are available is 2019-20, grant aid and net prices for
2020-21 and after are projected and shown in dotted lines.
Higher Education Emergency Relief Fund is included in the
2019-20 grant aid data and projected for later years. Room
and board expenses are estimated based on housing and
food allowances for commuter students.
SOURCES: College Board, Annual Survey of Colleges; NCES,
IPEDS Student Financial Aid data.
18
For detailed data behind the graphs and additional information, please visit: research.collegeboard.org/trends.
Average Net Price: Public Four-Year
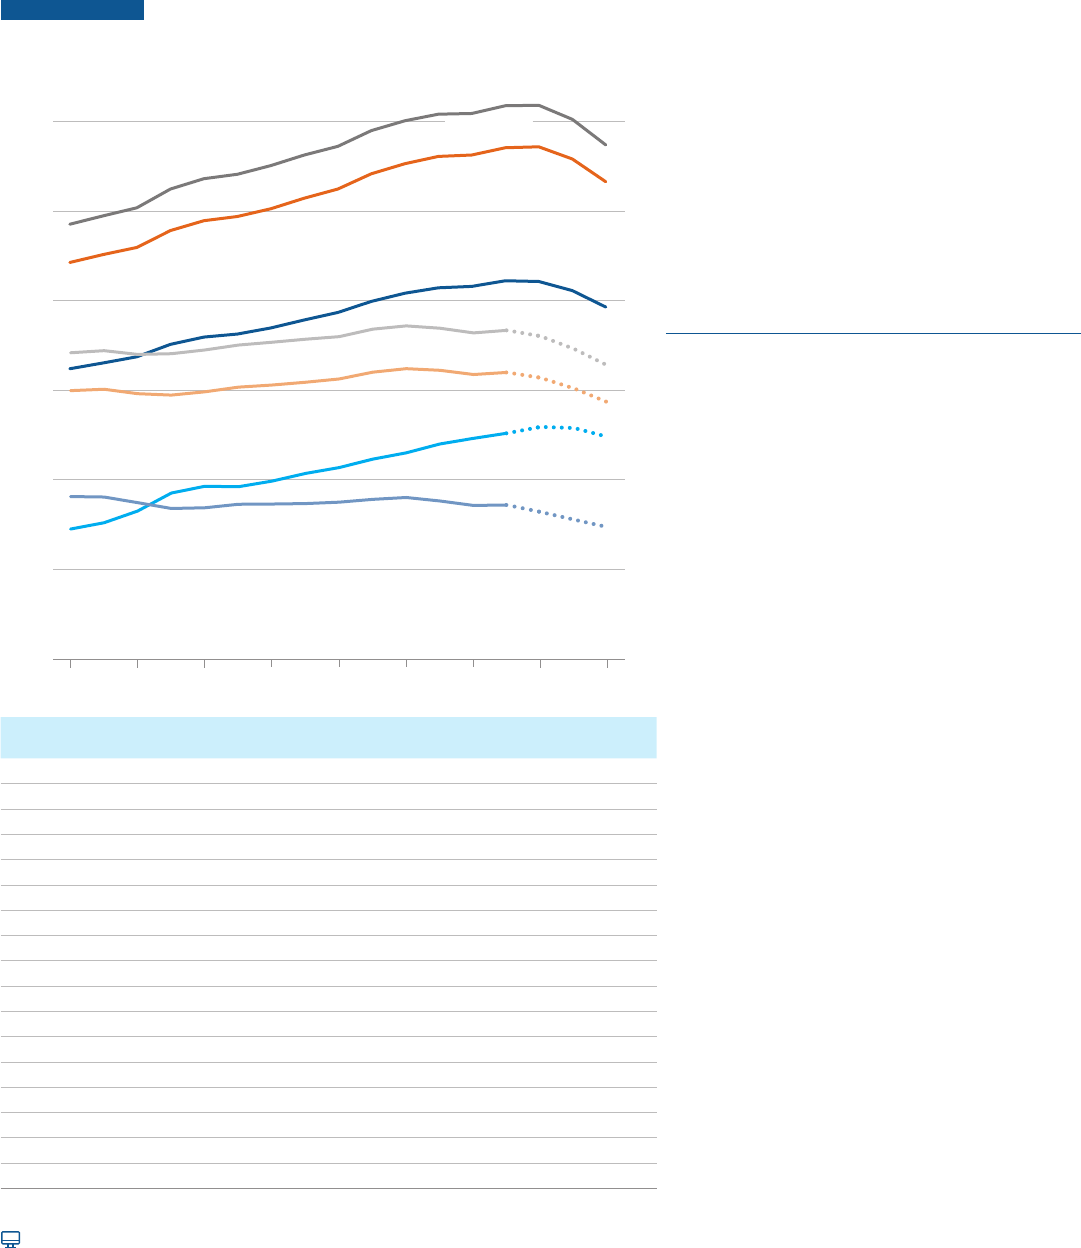
Since 2016-17, the average net tuition and fee price paid by rst-time full-time in-state students
enrolled in public four-year institutions has been declining after adjusting for ination; it was an estimated
$2,250 in 2022-23.
FIGURE CP-9 Average Published and Net Prices in 2022 Dollars, First-Time
Full-Time In-State Undergraduate Students at Public Four-Year
Institutions, 2006-07 to 2022-23
$0
$5,000
$10,000
$15,000
$20,000
$25,000
$30,000
Published Tuition and Fees
and Room and Board (TFRB)
Published
Tuition and Fees (TF)
Published Cost
of Attendance (COA)
Net COA
Grant Aid
Net TFRB
Net TF
Public Four-Year
10-11 12-13 16-17 18-19 22-2308-09 14-15 20-2106-07
Published
TF
Published
TFRB
Published
COA
Grant Aid
per Student Net TF Net TFRB Net COA
06-07 $8,440 $18,690 $23,870 $4,760 $3,680 $13,930 $19,110
07-08 $8,760 $19,190 $24,500 $5,160 $3,600 $14,030 $19,340
08-09 $9,000 $19,590 $25,020 $5,490 $3,510 $14,100 $19,530
09-10 $9,670 $20,850 $26,560 $6,460 $3,210 $14,390 $20,100
10-11 $10,270 $21,780 $27,430 $6,990 $3,280 $14,790 $20,440
11-12 $10,800 $22,390 $28,020 $6,830 $3,970 $15,560 $21,190
12-13 $11,060 $22,780 $28,400 $7,000 $4,060 $15,780 $21,400
13-14 $11,200 $23,150 $28,740 $7,250 $3,950 $15,900 $21,490
14-15 $11,340 $23,470 $29,000 $7,480 $3,860 $15,990 $21,520
15-16 $11,680 $24,230 $29,820 $7,660 $4,020 $16,570 $22,160
16-17 $11,820 $24,640 $30,160 $7,820 $4,000 $16,820 $22,340
17-18 $11,950 $24,890 $30,300 $8,240 $3,710 $16,650 $22,060
18-19 $11,930 $25,010 $30,290 $8,340 $3,590 $16,670 $21,950
19-20 $11,980 $25,200 $30,520 $8,850 $3,130 $16,350 $21,670
20-21 $11,990 $25,270 $30,540 $9,090 $2,900 $16,180 $21,450
21-22 $11,640 $24,580 $29,610 $9,040 $2,600 $15,540 $20,570
22-23 $10,940 $23,250 $27,940 $8,690 $2,250 $14,560 $19,250
In 2022-23, rst-time full-time in-state students
at public four-year colleges need to cover an
estimated average of $14,560 in tuition and fees
and room and board after grant aid, in addition
to $4,690 in allowances for books and supplies,
transportation, and other personal expenses.
Between 2006-07 and 2022-23, average grant aid
per rst-time full-time in-state student at public
four-year colleges increased by $3,930 after
adjusting for ination, from $4,760 (in 2022 dollars)
to an estimated $8,690; average published tuition
and fees in this sector increased by $2,500, from
$8,440 (in 2022 dollars) to $10,940.
ALSO IMPORTANT:
In 2019-20, the latest year for which detailed
nancial aid data are available from IPEDS, 49% of
the total $8,850 (in 2022 dollars) in grant aid per
rst-time full-time in-state student in the public
four-year sector comes from institutional grant aid
provided by colleges and universities in the form of
discounts from their published prices.
The average net prices in Figure CP-9 are calculated
among all rst-time full-time undergraduate
students in the public four-year sector, including
those who did not receive grant aid. In 2019-20,
78% of rst-time full-time undergraduate students
in this sector received federal, state, or institutional
grant aid.
NOTE: Average net price is calculated as the dierence
between published price from College Board’s Annual Survey
of Colleges and grant aid from IPEDS Student Financial Aid
data. Because the latest year for which grant aid data are
available is 2019-20, grant aid and net prices for 2020-21 and
after are projected and shown in dotted lines. Higher Education
Emergency Relief Fund is included in the 2019-20 grant aid data
and projected for later years.
SOURCE: College Board, Annual Survey of Colleges; NCES,
IPEDS Student Financial Aid data.
19
For detailed data behind the graphs and additional information, please visit: research.collegeboard.org/trends.
Average Net Price: Private Nonprot Four-Year
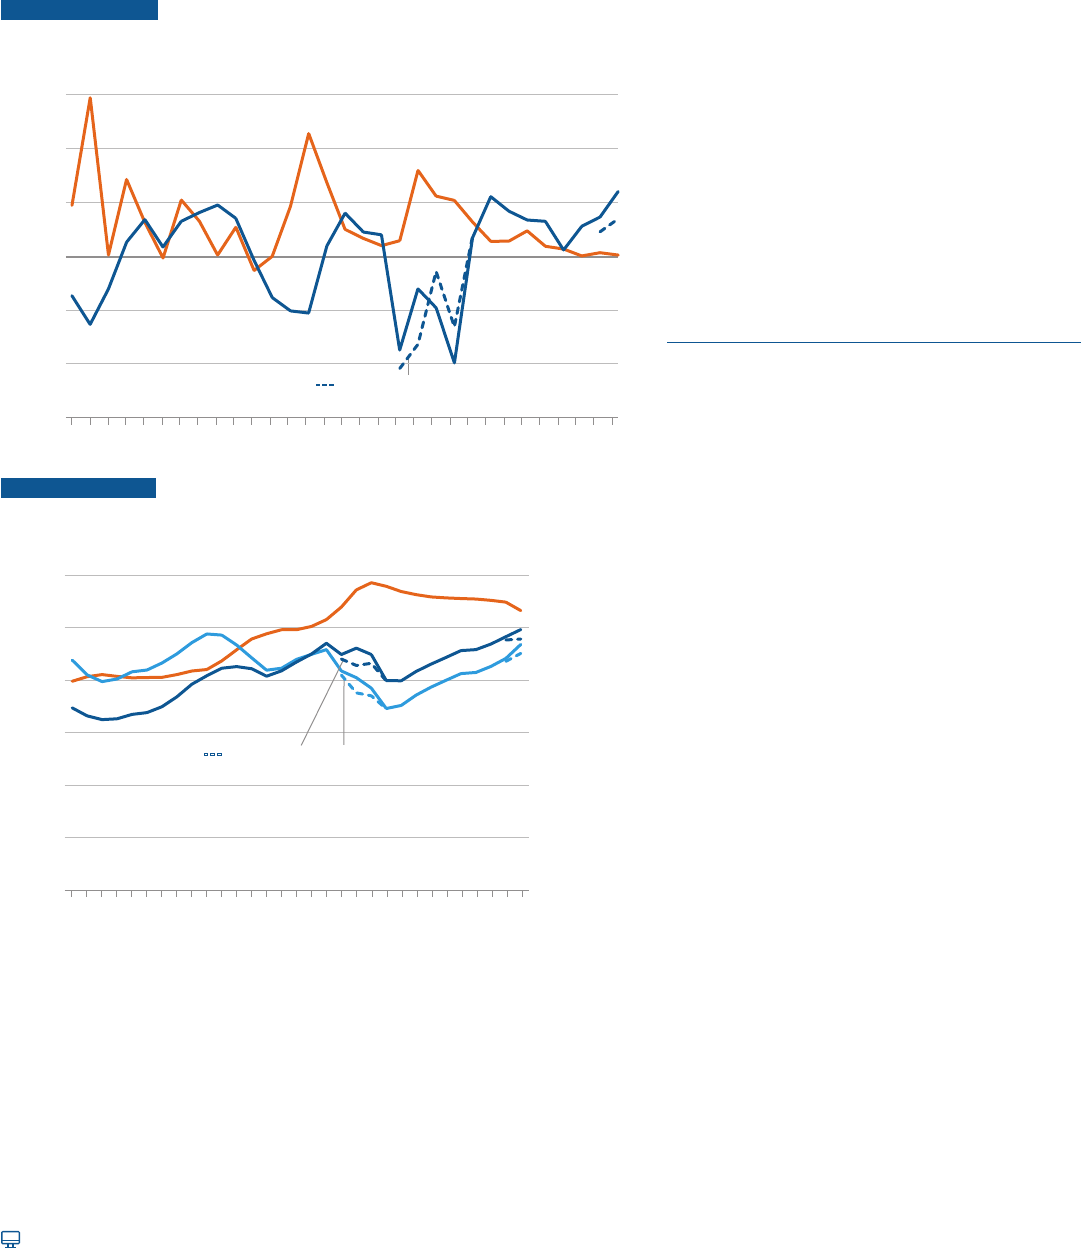
Since 2017-18, the average net tuition and fee price paid by rst-time full-time students enrolled in
private nonprot four-year institutions has been declining after adjusting for ination; it was an estimated
$14,630 in 2022-23.
FIGURE CP-10 Average Published and Net Prices in 2022 Dollars, First-Time
Full-Time Undergraduate Students at Private Nonprot Four-Year
Institutions, 2006-07 to 2022-23
$0
$20,000
$10,000
$30,000
$40,000
$60,000
$50,000
Published Tuition and Fees
and Room and Board (TFRB)
Net TFRB
Published Cost
of Attendance (COA)
Net COA
Grant Aid
Published
Tuition and Fees (TF)
Net TF
Private Nonprofit Four-Year
10-11 12-13 16-17 18-19 22-2308-09 14-15 20-2106-07
Published
TF
Published
TFRB
Published
COA
Grant Aid
per Student Net TF Net TFRB Net COA
06-07 $32,480 $44,400 $48,670 $14,420 $18,060 $29,980 $34,250
07-08 $33,150 $45,280 $49,620 $15,130 $18,020 $30,150 $34,490
08-09 $33,830 $46,070 $50,510 $16,440 $17,390 $29,630 $34,070
09-10 $35,210 $47,970 $52,610 $18,480 $16,730 $29,490 $34,130
10-11 $36,030 $49,080 $53,770 $19,220 $16,810 $29,860 $34,550
11-12 $36,370 $49,540 $54,280 $19,170 $17,200 $30,370 $35,110
12-13 $37,050 $50,420 $55,240 $19,810 $17,240 $30,610 $35,430
13-14 $37,960 $51,600 $56,430 $20,670 $17,290 $30,930 $35,760
14-15 $38,780 $52,620 $57,400 $21,330 $17,450 $31,290 $36,070
15-16 $40,040 $54,330 $59,170 $22,280 $17,760 $32,050 $36,890
16-17 $40,960 $55,450 $60,280 $23,000 $17,960 $32,450 $37,280
17-18 $41,560 $56,270 $61,000 $23,990 $17,570 $32,280 $37,010
18-19 $41,700 $56,430 $61,100 $24,620 $17,080 $31,810 $36,480
19-20 $42,330 $57,240 $61,960 $25,200 $17,130 $32,040 $36,760
20-21 $42,260 $57,350 $62,010 $25,910 $16,350 $31,440 $36,100
21-22 $41,230 $55,980 $60,430 $25,770 $15,460 $30,210 $34,660
22-23 $39,400 $53,430 $57,570 $24,770 $14,630 $28,660 $32,800
In 2022-23, rst-time full-time students at private
nonprot four-year colleges need to cover an
estimated average of $28,660 in tuition and fees
and room and board after grant aid, in addition
to $4,140 in allowances for books and supplies,
transportation, and other personal expenses.
Between 2006-07 and 2022-23, average grant aid
per rst-time full-time student at private nonprot
four-year colleges increased from $14,420 (in
2022 dollars) to an estimated $24,770; average
published tuition and fees in this sector increased
from $32,480 (in 2022 dollars) to $39,400 during
this time period.
ALSO IMPORTANT:
In 2019-20, the latest year for which detailed
nancial aid data are available from IPEDS, 86%
of the total $25,200 (in 2022 dollars) in grant
aid per rst-time full-time student in the private
nonprot four-year sector comes from colleges
and universities in the form of discounts from their
published prices.
The average net prices in Figure CP-10 are
calculated among all rst-time full-time
undergraduate students in the private nonprot
four-year sector, including those who did not
receive grant aid. In 2019-20, 88% of rst-time
full-time undergraduate students in this sector
received federal, state, or institutional grant aid.
NOTE: Average net price is calculated as the dierence
between published price from College Board’s Annual Survey
of Colleges and grant aid from IPEDS Student Financial Aid
data. Because the latest year for which grant aid data are
available is 2019-20, grant aid and net prices for 2020-21
and after are projected and shown in dotted lines. Higher
Education Emergency Relief Fund is included in the 2019-20
grant aid data and projected for later years.
SOURCE: College Board, Annual Survey of Colleges; NCES,
IPEDS Student Financial Aid data.
20
research.collegeboard.org/trends.
Institutional Revenues:
State and Local Funding
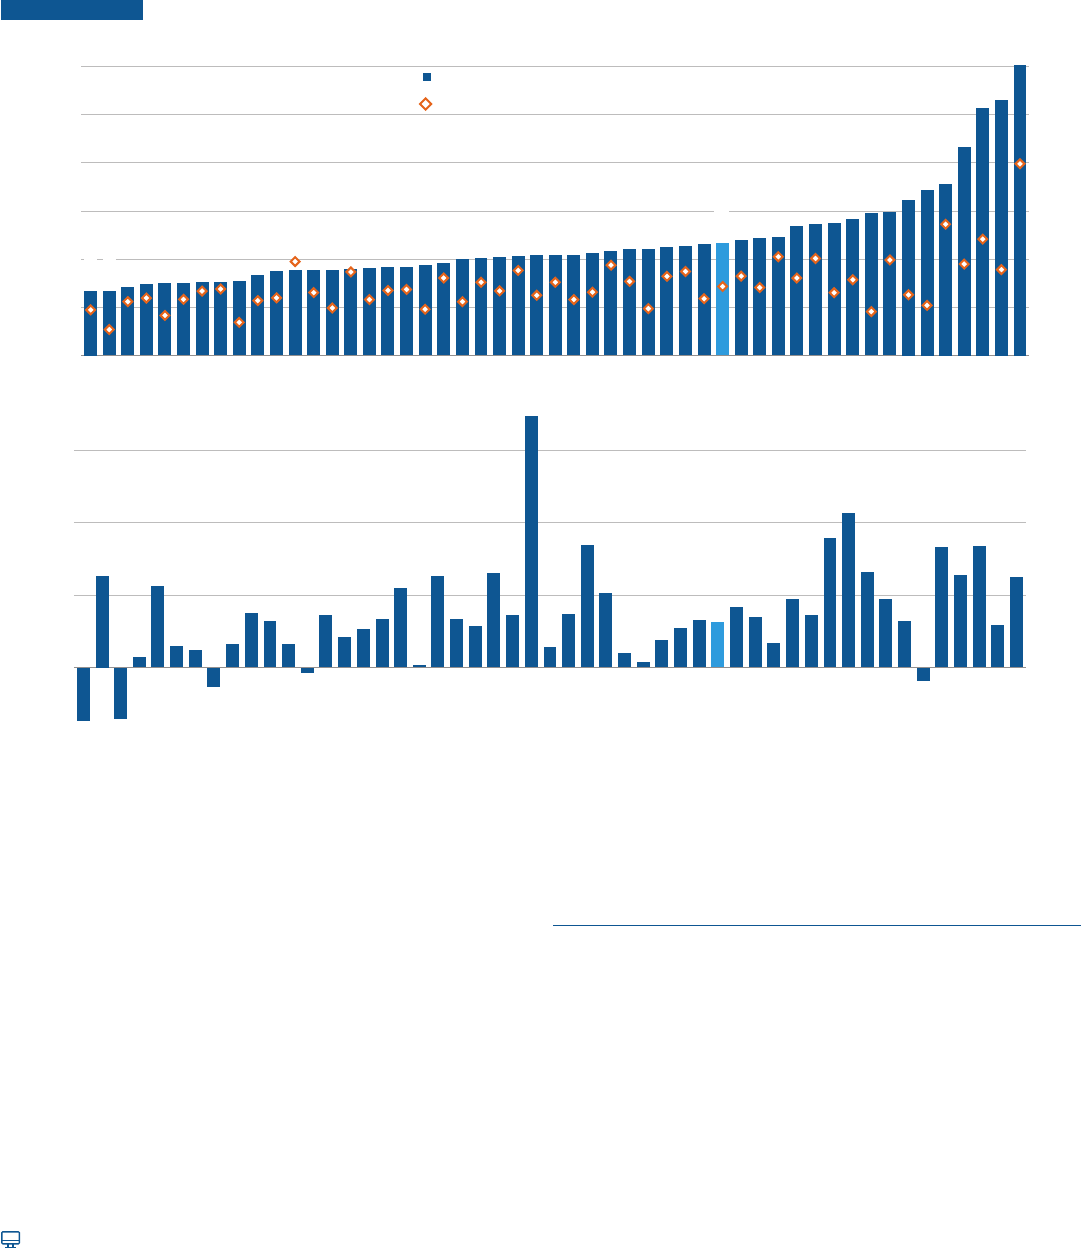
State and local funding for higher education tends to be cyclical. Historically, declines in state and local
funding per student were followed by large percentage increases in tuition and fees in the public sector.
FIGURE CP-11A
15%
10%
5%
0%
–5%
–10%
Tuition and Fees
Funding per FTE Student
- - - Excluding Federal Stimulus Funds
Percentage Change
–15%
90-91 93-94 96-97 99-00 02-03 05-06 08-09 11-12 14-15 17-18 20-
21
FIGURE CP-11B
1990-91 to 2020-21
Total Funding (in Billions of 2020 Dollars)
$120 ($)12
$100
($)10
$80
($)8
$60
($)6
Public FTE Enrollment (Millions)
Total Funding (Billions) Funding per FTE (Thousands)
- - - Excluding Federal Stimulus Funds
Public FTE Enrollment (in Millions)
and Funding per FTE Student
(in Thousands of 2020 Dollars)
$40
($)4
$20
($)2
$0
90-91 93-94 96-97 99-00 02-03 05-06 08-09 11-12 14-15 17-18
($)0
20-21
excluding medical students. Annual percentage changes in public tuition and fees are the averages
of annual percentage changes in tuition and fees in the public four-year and public two-year
other state and local funds for higher education, but not funding for capital expenditures.
Digest of Education Statistics, 2021,
The national average state and local funding per
dollars) for the ninth consecutive year, following
four years of decline during and after the Great
Recession of 2008.
State and local funding per student reached $9,330
in 2020-21, the highest level since 2000-01 when it
was $9,680 (in 2020 dollars).
In the last 30 years, total state and local funding
funding per student increased by 7%.
ALSO IMPORTANT:
In response to the Covid-19 pandemic, the federal
government provided stimulus funding that
supplemented state and local funding for higher
Similarly, the federal government provided stimulus
funding for higher education during the Great
Recession of 2008. This funding was available from
2008-09 through 2011-12.
21
For detailed data behind the graphs and additional information, please visit: research.collegeboard.org/trends.
Institutional Revenues:
State and Local Funding
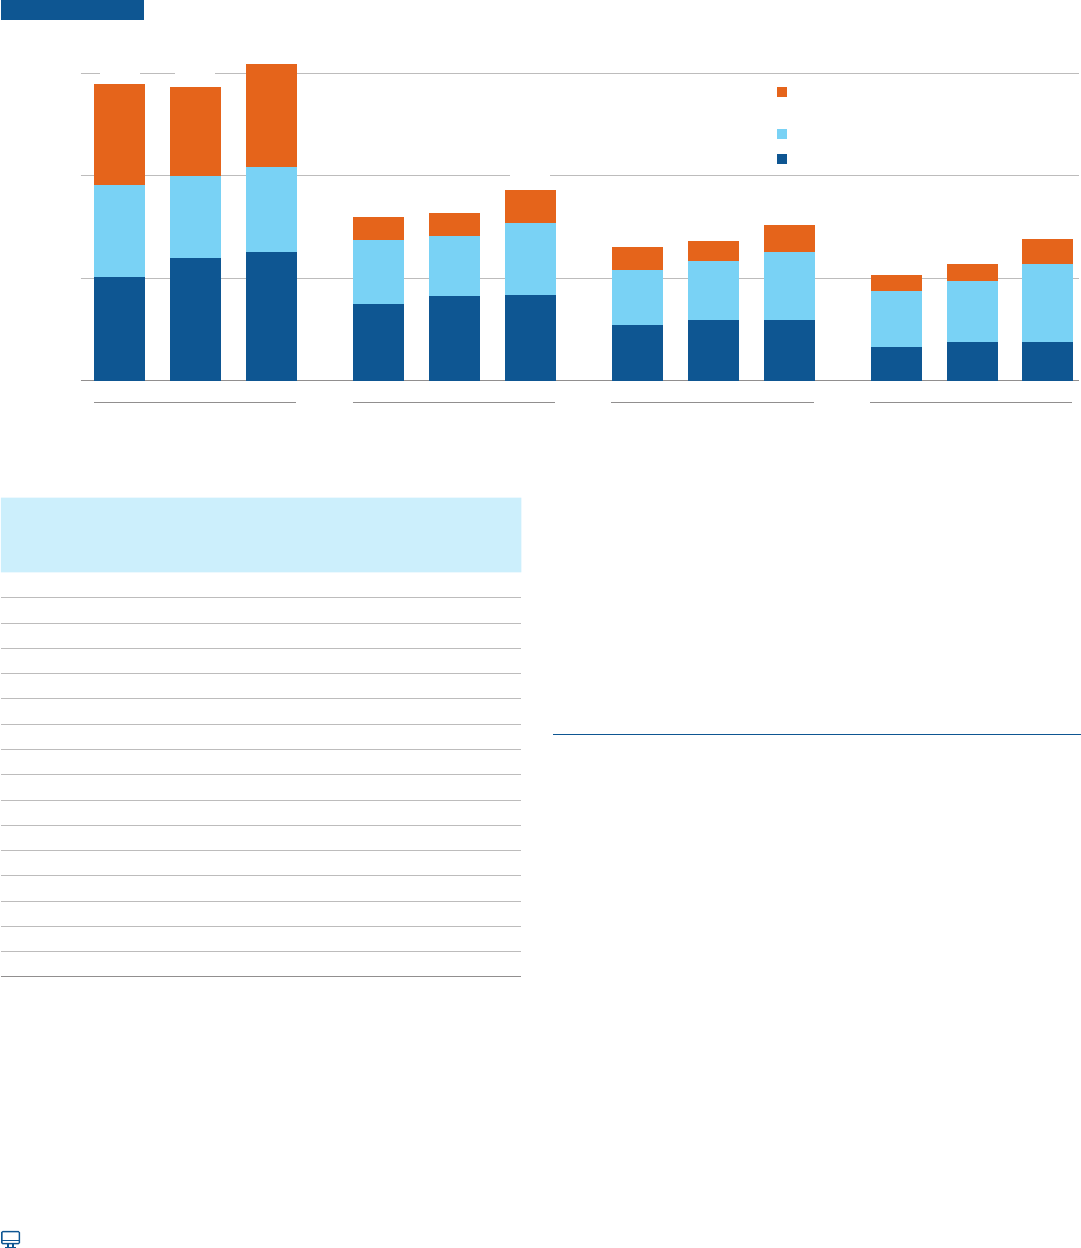
In 2020-21, state and local funding for public higher education averaged $9,330 per full-time equivalent
(FTE) student in the United States; it ranged from $5,350 in Oklahoma and $5,380 in New Hampshire to
more than $20,000 in Hawaii, Alaska, and Wyoming.
FIGURE CP-12 2020-21 State and Local Funding for Higher Education per Student and per $1,000 in Personal Income and 10-Year Percentage
Changes in Ination-Adjusted Funding per Student, by State
$9,330
$5.04
$8,000
$12,000
$16,000
$20,000
$4,000
$24,000
$0
OK
NH
LA
IA
CO
IN
WV
AZ
PA
OH
SD
MS
KY
RI
AL
VA
MI
SC
NV
AR
MO
DE
MT
KS
VT
TX
FL
OR
UT
WI
NJ
GA
ND
ME
US
ID
TN
NC
10%
–10%
–3%
1%
51%
52%
139%
68%
3%
25%
0%
40%
80%
120%
Oklahoma
–29%
51%
–28%
New Hampshire
Louisiana
Iowa
Colorado
Indiana
West Virginia
Arizona
Pennsylvania
Ohio
South Dakota
Mississippi
Kentucky
Rhode Island
Alabama
Virginia
Michigan
South Carolina
Nevada
Arkansas
Missouri
Delaware
Montana
Kansas
Vermont
Texas
Florida
Oregon
Utah
Wisconsin
New Jersey
Georgia
North Dakota
Maine
United States
Idaho
Tennessee
10-Year Percentage Change in
Inflation-Adjusted Funding per FTE Student
MD
NE
WA
MN
MA
CA
$21,210
$20,540
$24,100
$0
$4
$8
$12
$16
$20
$24
NY
CT
NM
IL
HI
AK
WY
2020-21 Funding per $1,000 in Personal Income
72%
85%
53%
–8%
67%
51%
67%
24%
50%
North Carolina
Maryland
Nebraska
Washington
Minnesota
Massachusetts
California
New York
Connecticut
New Mexico
Illinois
Hawaii
Alaska
Wyoming
Funding per Public FTE Student
Funding per $1,000 in Personal Income
$5,350
$5,380
2020-21 Funding per FTE Student
SOURCE: SHEEO, SHEF reports; Bureau of Economic Analysis, Annual State Personal Income 2020; calculations by the authors.
Between 2010-11 and 2020-21, ination-adjusted per-student
state and local funding for higher education increased by 25% in
the United States and increased by 50% or more in 12 states.
Between 2010-11 and 2020-21, ination-adjusted per-student
state and local funding for higher education declined in ve states.
ALSO IMPORTANT:
Federal stimulus funding is reected in Figure CP-12. In Vermont,
federal stimulus funding accounted for 42% of total state and
local funding in 2020-21. Excluding the federal stimulus, the
10-year percentage change in ination-adjusted per-student
funding in Vermont is 40%. (Authors’ calculations using SHEEO
SHEF data)
22
For detailed data behind the graphs and additional information, please visit: research.collegeboard.org/trends.
Institutional Revenues: Public Institutions
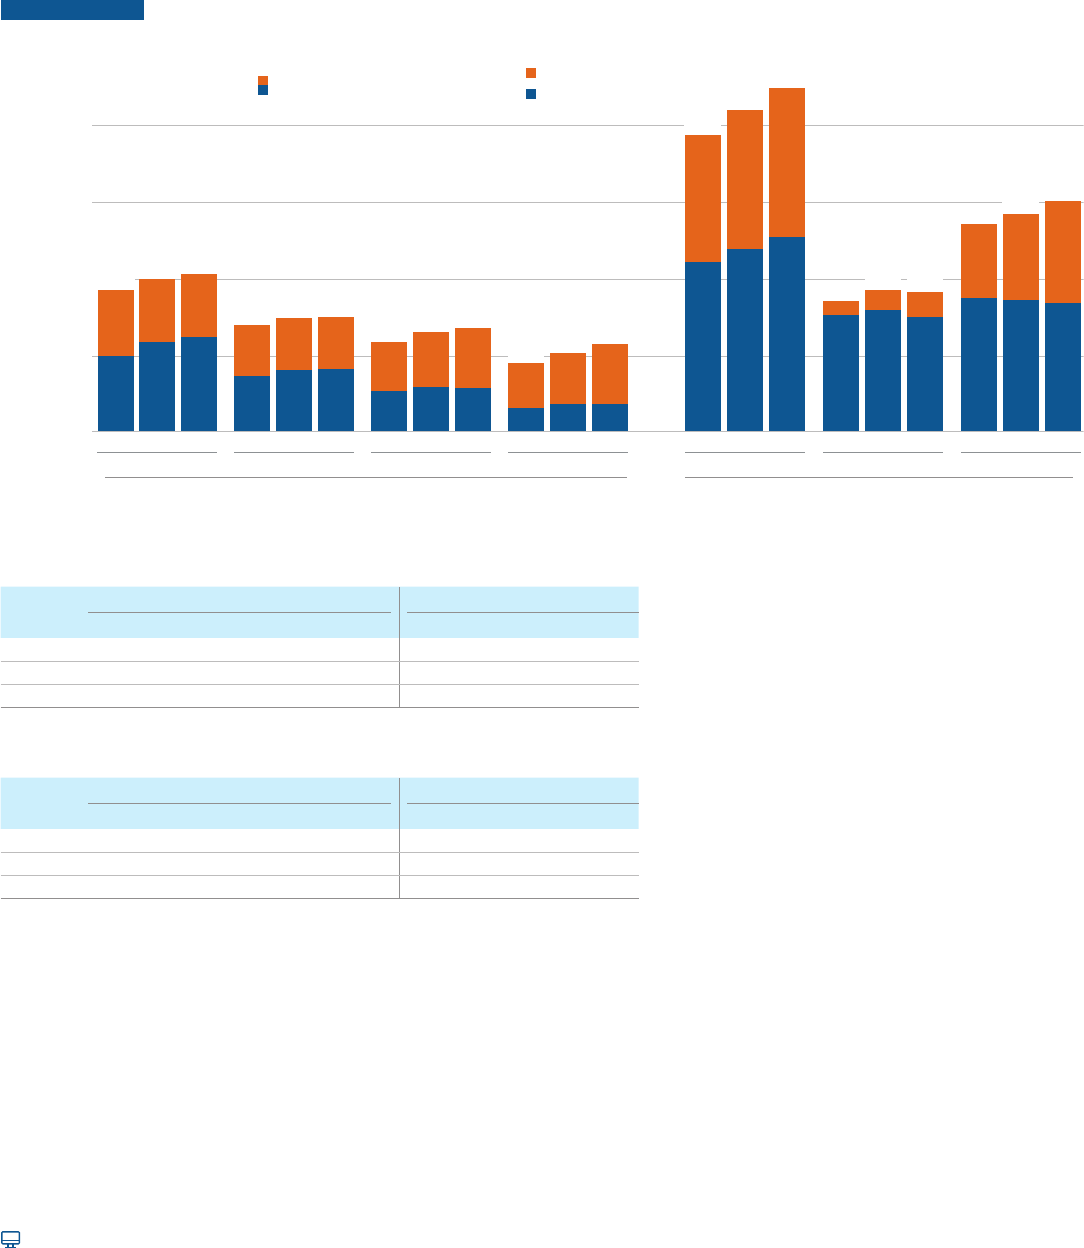
In 2019-20, net tuition revenue accounted for 41% of total revenues at public doctoral universities.
Net tuition as a share of total revenues in this sector remained stable between 2014-15 and 2019-20,
after increasing from 35% to 42% during the previous ve years.
FIGURE CP-13 Institutional Revenues per Full-Time Equivalent (FTE) Student in 2019 Dollars at Public Institutions, 2009-10, 2014-15,
and 2019-20
2009-10 2014-15
2019-20 2009-10 2014-15 2019-20 2009-10 2014-15 2019-20
2009-10 2014-15 2019-20
Revenue in 2019 Dollars
Public Doctoral Public Master’s Public Bachelor’s Public Associate
Federal Appropriations and Federal, State,
and Local Grants and Contracts
State and Local Appropriations
Net Tuition Revenue
$0
$10,000
$20,000
$30,000
$9,820
$8,610
$28,640
$10,010
$30,890
$28,970
$16,000
$16,330
$18,580
$13,020
$13,620
$15,150
$10,300
$11,350
$13,780
$5,470
$5,970
$7,540
$3,220
$3,740
$3,770
$5,400
$5,430
$5,920
$5,730
$5,860
$6,680
$7,480
$8,220
$8,320
$6,280
$5,930
$7,100
$9,070
$8,070
$8,320
$12,560
$10,080
$11,960
$2,240
$2,180
$3,160
$2,190
$1,970
$2,610
$1,610
$1,640
$2,470
Percentage of Institutional Revenues from Various Sources
Net Tuition
Revenue
State and Local
Appropriations
Federal Appropriations
and Federal, State,
and Local Grants and
Contracts
Public Doctoral
2009-10 35% 31% 34%
2014-15 42% 28% 30%
2019-20 41% 27% 32%
P
ublic Master’s
2009-10 47% 39% 14%
2014-15 50% 36% 13%
2019-20 45% 38% 17%
Public Bachelor’s
2009-10 41% 42% 17%
2014-15 43% 42% 14%
2019-20 39% 44% 17%
Public Associate
2009-10 31% 53% 16%
2014-15 33% 53% 14%
2019-20 27% 55% 18%
NOTE: Net tuition revenue is the amount of revenue an institution takes in from
tuition and fees, net of all institutional grant aid provided to students. Some of
this revenue comes in the form of Pell Grants and other nancial aid from federal
and state governments and other sources. Institutional averages are weighted by
12-month FTE enrollments including both undergraduate and graduate students.
Institution groupings are based on the 2018 Carnegie Classication. Percentages
may not sum to 100 because of rounding.
SOURCE: NCES, IPEDS Finance and 12-Month Enrollment data, 2010, 2015 and
2020; calculations by the authors.
At other types of public institutions, net tuition as a share of total
revenues declined between 2014-15 and 2019-20, after increasing
during the previous ve years.
In 2019-20, per-student revenues from the combination of
government sources and net tuition were more than twice as
large at public doctoral universities as at public bachelor’s and
two-year colleges. These per-student revenues were $30,890 at
doctoral universities, $18,580 at master’s universities, $15,150
at bachelor’s colleges, and $13,780 at associate colleges in the
public sector.
ALSO IMPORTANT:
In addition to the revenue sources included in Figure CP-13,
institutions also receive revenues from gifts and investment
returns, which account for a small share of total revenues at
public institutions.
Revenues from auxiliary enterprises such as residence halls,
dining facilities, hospitals, and independent operations, not
included in Figure CP-13, are usually dedicated to running those
operations.
23
For detailed data behind the graphs and additional information, please visit: research.collegeboard.org/trends.
Institutional Revenues and Expenditures
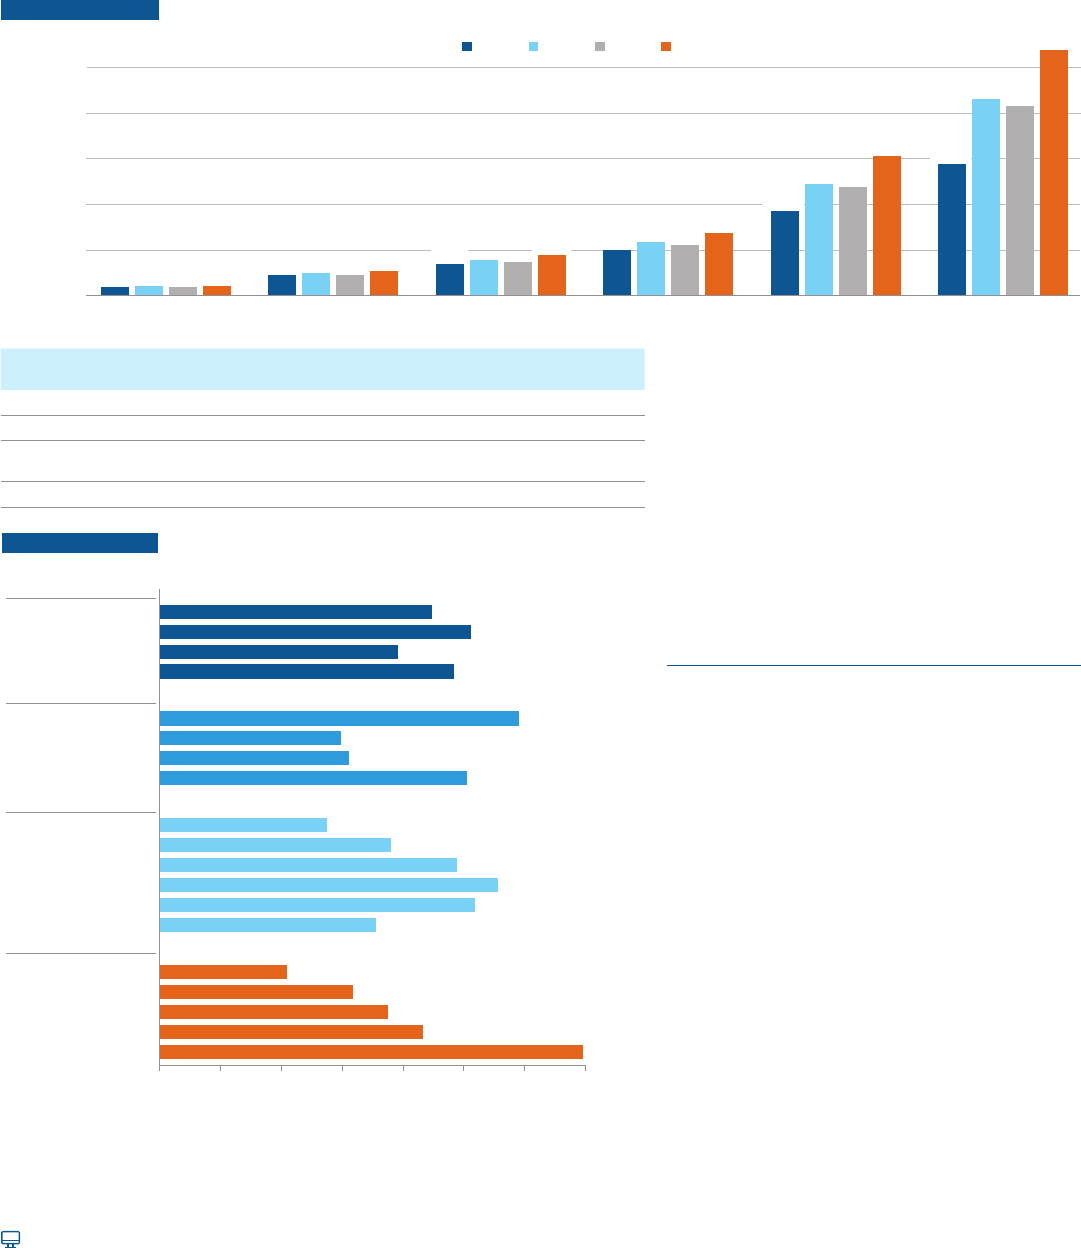
Between 2014-15 and 2019-20, the average subsidy per full-time equivalent (FTE) student increased
(after adjusting for ination) at all types of public and private nonprot institutions.
FIGURE CP-14 Net Tuition Revenues, Subsidies, and Education and Related Expenditures per Full-Time Equivalent (FTE) Student in 2019
Dollars, 2009-10, 2014-15, and 2019-20
$8,220
$6,920
$15,140
$8,320
$6,950
$15,270
$5,400
$6,540
$11,940
$5,920
$7,280
$13,200
$5,860
$7,880
$13,740
$3,220
$5,970
$9,190
$3,740
$6,770
$10,510
$3,770
$7,880
$11,650
$22,470
$16,910
$39,380
$24,280
$18,350
$42,630
$25,800
$19,800
$45,600
$15,560
$1,790
$17,350
$15,930
$2,640
$15,270
$3,230
$17,730
$9,860
$27,590
$17,560
$11,320
$17,070
$13,510
$30,580
2014-15 2019-20 2009-10 2014-15 2019-20 2009-10 2014-15 2019-20 2009-10 2014-15 2019-20 2009-10 2014-15 2019-20 2009-10 2014-15 2019-20
Doctoral
Master
’
s
Bachelor
’
s
Public
Private Nonprofit
Education and Related Expenditures per FTE Student
(in 2019 Dollars)
$10,080
$8,690
$11,960
$8,260
$20,220
$12,560
$8,380
$20,940
$7,480
$6,650
$14,130
$0
$10,000
$20,000
$30,000
$40,000
2009-10 2014-15 2019-20 2009-10
Master
’
s
Bachelor
’
s
Associate
Doctoral
Net Tuition Revenue
Subsidy
$18,770
$18,570
$18,500
$28,880
Education and Related Expenditures
$3,220
$3,740
$3,770
Institutional Subsidy as a Percentage of Education and Related Expenditures
Public Private Nonprot
Doctoral Master’s Bachelor’s Associate Doctoral Master’s Bachelor’s
2009-10 46% 47% 55% 65% 43% 10% 36%
2014-15 41% 46% 55% 64% 43% 14% 39%
2019-20 40% 46% 57% 68% 43% 17% 44%
Net Tuition as a Percentage of Education and Related Expenditures
Public Private Nonprot
Doctoral Master’s Bachelor’s Associate Doctoral Master’s Bachelor’s
2009-10 54% 53% 45% 35% 57% 90% 64%
2014-15 59% 54% 45% 36% 57% 86% 61%
2019-20 60% 54% 43% 32% 57% 83% 56%
NOTE: Institutional subsidy to students represents the portion of the cost of educating students
not covered by net tuition revenue. Net tuition revenue is the amount of revenue an institution takes
in from tuition and fees, net of all institutional grant aid provided to students. Some of this revenue
comes in the form of Pell Grants and other nancial aid from federal and state governments and
other sources. Institutional averages are weighted by 12-month FTE enrollments including both
undergraduate and graduate students. Institution groupings are based on the 2018 Carnegie
Classication. The percentages in the top table are not institutional discount rates, which represent
institutional grant aid as a share of published tuition and fees.
SOURCE: NCES, IPEDS Finance and 12-Month Enrollment data, 2010, 2015, and 2020; calculations
by the authors.
Education and related (E&R) expenditures include
spending on instruction, student services, and
the education share of spending on central
academic and administrative support, as well as
operations and maintenance. These expenditures
can be considered institutions’ costs of providing
education to students. A portion of these
expenditures is covered by net tuition revenues
from students and the remaining portion is a subsidy
to students. In addition to E&R expenditures,
institutional budgets include expenditures for other
purposes such as research, public service, and
auxiliary enterprises.
In 2019-20, the share of E&R expenditures at
public institutions that was subsidy to students
ranged from 40% at doctoral institutions to 68%
at associate colleges.
In 2019-20, the share of E&R expenditures at private
nonprot institutions that was subsidy to students
was 17% at master’s institutions, 43% at doctoral
institutions, and 44% at bachelor’s colleges.
24
For detailed data behind the graphs and additional information, please visit: research.collegeboard.org/trends.
Family Income
Between 1991 and 2021, the average income increased by 64% for the top quintile of families and by 17%
for the lowest quintile of families, after adjusting for ination.
FIGURE CP-15A Mean Family Income in 2021 Dollars by Quintile, 1991, 2001, 2011, and 2021
Mean Family Income
$0
$100,000
$200,000
$500,000
$400,000
$300,000
Lowest 20% Second 20% Third 20% Fourth 20% Highest 20% Top 5%
1991 2001 2011 2021
$18,940
$44,950
$22,120
$54,980
$69,740
$88,960
$101,160
$137,650
$185,840
$305,500
$287,560
$538,470
Lowest
20%
Second
20%
Third
20%
Fourth
20%
Highest
20%
Top
5%
$ Change from 1991 to 2021 $3,180 $10,030 $19,220 $36,490 $119,660 $250,910
% Change from 1991 to 2021 17% 22% 28% 36% 64% 87%
2021 Income Bracket
$40,000
or Less
$40,001 to
$70,506
$70,507 to
$109,354
$109,355 to
$174,001
$174,002
or More
$319,770
or More
2021 Mean Income $22,120 $54,980 $88,960 $137,650 $305,500 $538,470
FIGURE CP-15B Median Family Income by Selected Characteristics, 2021
$86,570
$75,210
$63,450
$41,740
$71,190
$103,640
$111,220
$97,680
$76,060
$55,010
$100,980
$62,300
$59,540
$118,390
$96,680
$78,480
$102,320
$89,520
$0 $20,000 $40,000 $60,000 $80,000 $100,000 $120,000
Bachelor’s Degree or Higher
Associate Degree
Some College
High School
Less Than High School
65 and over
55 to 64
45 to 54
35 to 44
25 to 34
15 to 24
White Alone, Non-Hispanic
Hispanic
Black Alone, Non-Hispanic
Asian Alone, Non-Hispanic
West
South
Northeast
Midwest
Education
Age
Race/Ethnicity
Region
2021 Median Family Income (Median of All Families = $88,590)
$140,000
$139,300
SOURCE: U.S. Census Bureau, Current Population Survey, 2021 Annual Social and Economic
Supplement, Table F-1, Table F-3, Table F-5, and FINC-01; calculations by the authors.
In 2021, average incomes ranged from $22,120
for the lowest quintile to $305,500 for the highest
quintile and $538,470 for the top 5% of families.
In 2021, the median income of families headed
by individuals ages 45 to 54—the age bracket of
parents of most traditional-age college students—
was 26% higher than the overall median ($111,220
compared with $88,590).
In 2021, the $139,300 median family income of
families with at least one four-year college graduate
was more than double the median for families
headed by a high school graduate ($63,450).
ALSO IMPORTANT:
The share of all income going to the 20% of
families with the lowest incomes declined from
4.5% in 1991 to 3.6% in 2021. The share of income
going to the top 5% of families increased from
17.1% in 1991 to 22.1% in 2021. (U.S. Census
Bureau, Table F-2)

25
For detailed data behind the graphs and additional information, please visit: research.collegeboard.org/trends.
Enrollment Patterns over Time
Between fall 2000 and fall 2011, total postsecondary enrollment increased by 5.6 million (37%)—from
15.3 million to 20.9 million. Since the enrollment peak in fall 2011, total enrollment has declined by about
2 million (10%) to 18.9 million in fall 2020.
FIGURE CP-16 Postsecondary Fall Enrollment (in Millions) by Attendance Status and Level of Enrollment, 2000 to 2020
0
4
8
12
16
20
Enrollment (Millions)
Part-Time Undergraduate
All Graduate
Full-Time Undergraduate
2001
15.9
52%
34%
14%
2002
16.6
53%
33%
14%
2008
18.9
54%
32%
14%
2009
20.1
54%
32%
14%
2010
20.8
55%
31%
14%
2011
20.9
54%
32%
14%
2012
20.5
54%
32%
14%
2013
20.2
54%
32%
14%
2003
16.9
53%
32%
14%
2004
17.1
54%
32%
15%
2005
17.3
54%
32%
15%
2014
20.1
53%
32%
15%
2015
19.8
53%
32%
15%
2020
18.9
52%
32%
17%
2006
17.6
54%
32%
15%
2007
18.1
54%
32%
15%
2018
52%
32%
16%
19.5
2019
52%
32%
16%
19.5
2017
52%
32%
15%
19.6
2016
52%
32%
15%
19.7
2000
14%
34%
52%
15.3
NOTE: Includes degree-granting Title-IV institutions. Percentages may not sum to 100 because of rounding.
SOURCE: NCES, IPEDS Fall Enrollment data, 2000 through 2020; calculations by the authors.
Total Postsecondary Fall Enrollment (in Millions), 2000 to 2020
Year
Full-Time
Undergraduate
Part-Time
Undergraduate
All
Graduate Total
2000 7.9 5.2 2.2 15.3
2001 8.3 5.4 2.2 15.9
2002 8.7 5.5 2.4 16.6
2003 9.0 5.4 2.4 16.9
2004 9.2 5.4 2.5 17.1
2005 9.4 5.5 2.5 17.3
2006 9.5 5.6 2.6 17.6
2007 9.8 5.7 2.6 18.1
2008 10.2 6.1 2.7 18.9
2009 10.9 6.4 2.8 20.1
2010 11.4 6.6 2.9 20.8
2011 11.3 6.7 2.9 20.9
2012 11.0 6.6 2.9 20.5
2013 10.8 6.5 2.9 20.2
2014 10.7 6.5 2.9 20.1
2015 10.5 6.4 2.9 19.8
2016 10.3 6.4 3.0 19.7
2017 10.3 6.3 3.0 19.6
2018 10.2 6.3 3.0 19.5
2019 10.1 6.3 3.1 19.5
2020 9.7 6.0 3.1 18.9
NOTE: Components may not sum to totals because of rounding.
The share of full-time undergraduate students increased
from 52% of total in fall 2000 to 55% in fall 2010. It then
declined to 52% in fall 2020. The share of part-time
undergraduate students ranged between 31% and 34%
over the past two decades.
The share of graduate students rose from 14% of total
(2.2 million) in fall 2000 to 17% (3.1 million) in fall 2020.
ALSO IMPORTANT:
Students enrolled in non-degree-granting institutions,
who are not included in Figure CP-16, may be eligible for
federal student aid if they are working toward certicates
at accredited institutions. Some students enrolled in
degree-granting institutions are not eligible for federal
student aid because they are enrolled in non-credit-
bearing programs.
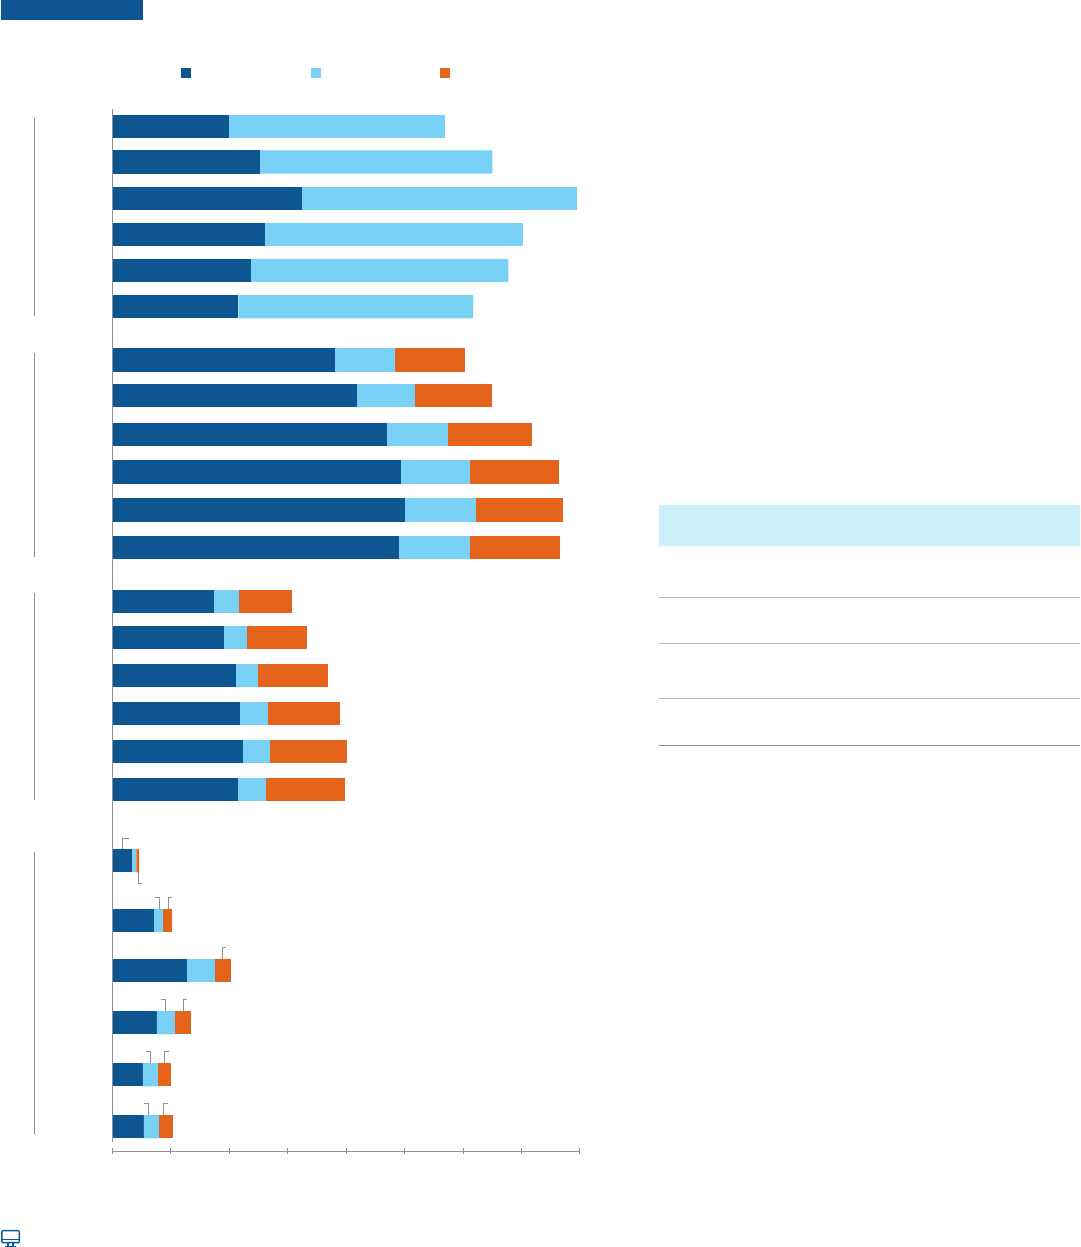
26
For detailed data behind the graphs and additional information, please visit: research.collegeboard.org/trends.
Enrollment Patterns over Time, by Sector
Between fall 2019 and fall 2020, the public two-year sector saw the largest decline in enrollment—581,000 (9%).
Total enrollment declined by 53,000 (0.7%) in the public four-year sector and by 29,000 (0.7%) in the private
nonprot four-year sector; it increased by 33,000 (3%) in the for-prot sector.
FIGURE CP-17 Postsecondary Fall Enrollment by Sector, Attendance Status, and
Level of Enrollment, 2000 to 2020, Selected Years
All
Graduate
Part-Time
Undergraduate
Full-Time
Undergraduate
37% 63%
7,037,000
39% 61%
6,514,000
35%
65% 5,697,000
0 1 2 3 4 5 6 7 8
Enrollment (Millions)
Public Two-Year
20%24%
1,346,00056%
23%25%
991,00051%
23%25%
1,024,000
52%
15%
23%
2,023,000
63%
16%
69%
1,011,000
14%
74%
10%
450,000
2015 (7%)
2019 (5%)
2020 (5%)
2010 (10%)
2005 (6%)
2000 (3%)
35% 65%
6,781,000
35%
65%
6,200,000
41% 59%
7,945
2015 (33%)
2019 (33%)
2020 (33%)
2010 (35%)
2005 (38%)
2000 (37%)
66% 15%
19%
7,531,00
65% 16% 19%
7,718,0
64% 16%
20%
7,665,0
65% 15% 20%
6,507,000
63%
17% 20% 6,055,000
56% 12% 32% 3,889,000
55% 12% 33% 4,015,000
54% 12% 34% 3,986,000
57% 10% 33% 3,686,000
57%
13% 29%
3,051,000
Public Four-Year
2015 (20%)
2019 (21%)
2020 (21%)
2010 (18%)
2000 (20%)
2005 (19%)
57% 11% 31% 3,316,000
2015 (38%)
2019 (40%)
2020 (41%)
2005 (38%)
2000 (40%)
2010 (35%)
66% 15% 19%
7,194,000
Private Nonprofit
Four-YearFor-Profit
35%
35%
,000
0
00
00
Between fall 2019 and 2020, total undergraduate
enrollment (including full-time and part-time
students) fell by 100,000 (2%) in the public four-year
sector and by 47,000 (2%) in the private nonprot
four-year sector; it increased by 29,000 (4%) in the
for-prot sector.
Between fall 2019 and 2020, total graduate student
enrollment rose by 46,000 (3%) in the public four-
year sector, by 18,000 (1%) in the private nonprot
four-year sector, and by 3,000 (1%) in the for-prot
sector.
Between 2000 and 2010, total enrollment in the for-
prot sector more than quadrupled, from 450,000
to 2,023,000. Since 2010, enrollment in this sector
declined by almost half, to 1,024,000 in 2020.
In the for-prot sector, graduate students rose from
10% of all students in fall 2000 to 15% in 2010 and to
23% in 2020.
Postsecondary Fall Enrollment by Sector, Attendance
Status, and Level of Enrollment, 2019 and 2020
Full-Time
Undergraduate
Part-Time
Undergraduate
All
Graduate Total
Public
Tw
o-Year
2019 2,378,000 4,403,000
—
6,781,000
2020 2,148,000 4,052,000
—
6,200,000
Public
Four-Year
2019 5,021,000 1,200,000 1,498,000 7,718,000
2020 4,910,000 1,211,000 1,544,000 7,665,000
Private
Nonprot
Four-Year
2019 2,216,000 463,000 1,337,000 4,015,000
2020 2,161,000 471,000 1,355,000 3,986,000
For-Prot 2019 508,000 251,000 233,000 991,000
2020 529,000 259,000 236,000 1,024,000
NOTE: Components may not sum to totals because of rounding.
NOTE: Includes degree-granting Title-IV institutions. Percentages
on the vertical axis represent the enrollment in each sector as a
percentage of total enrollment. Four-year institutions include only
those where more than 50% of degrees/certicates awarded are
bachelor’s degree or higher. Percentages may not sum to 100
because of rounding.
SOURCE: NCES, IPEDS Fall Enrollment data, 2000, 2005, 2010,
2015, 2019, and 2020; calculations by the authors.
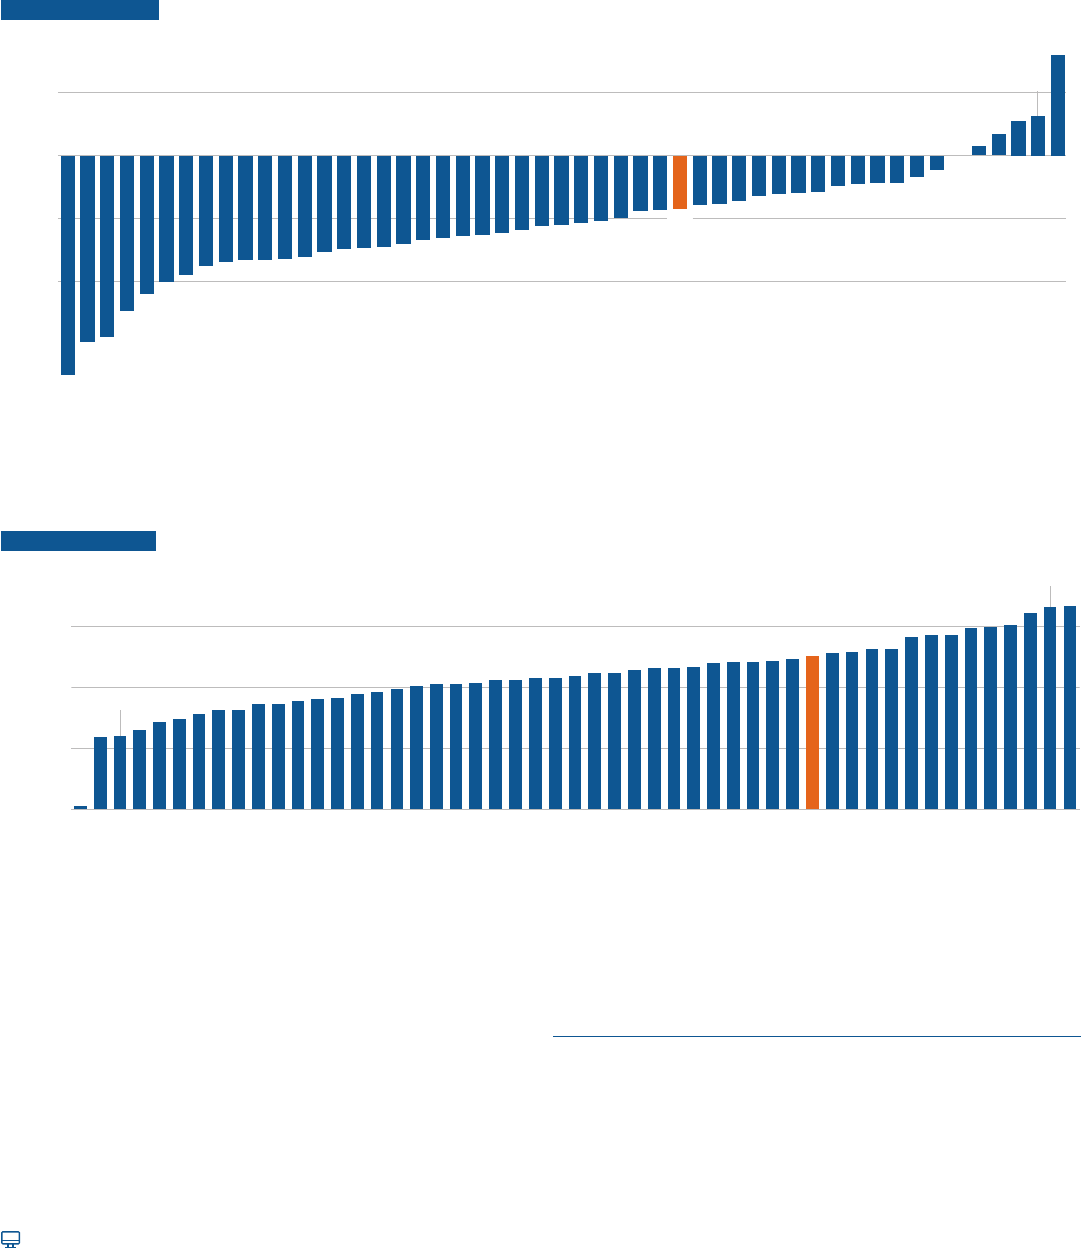
27
For detailed data behind the graphs and additional information, please visit: research.collegeboard.org/trends.
Public Enrollment by State
Between fall 2010 and fall 2020, total enrollment declined by 1.3 million (8%) at public colleges and universities
in the United States. Changes across states ranged from declines of 35% in Alaska and 30% in New Mexico to
an increase of 16% in Idaho.
FIGURE CP-18A Ten-Year Percentage Change in Total Enrollment at Public Institutions by State, Fall 2010 to Fall 2020
-
35%
-
30%
-
20%
6%
6%
16%
Percentage Change
Alaska
New Mexico
Illinois
Michigan
West Virginia
New Hampshire
Connecticut
Hawaii
Missouri
Oklahoma
Kentucky
Wyoming
Oregon
Minnesota
Massachusetts
Arkansas
Pennsylvania
New Jersey
Montana
Wisconsin
Washington
Iowa
Vermont
Kansas
Rhode Island
Mississippi
New York
Tennessee
Nebraska
North Dakota
Maine
United States
Virginia
Alabama
Maryland
Ohio
Louisiana
South Carolina
Nevada
South Dakota
California
Indiana
North Carolina
Florida
Arizona
Colorado
Georgia
Delaware
Utah
Texas
Idaho
-20%
-10%
0%
10%
-8%
FIGURE CP-18B Percentage of All Public Undergraduate Enrollment in Two-Year Institutions by State, Fall 2020
1%
50%
60%
0%
20%
40%
60%
Alaska
South Dakota
Montana
West Virginia
North Dakota
Indiana
Vermont
Louisiana
New Hampshire
Pennsylvania
Alabama
Delaware
Idaho
Georgia
Maine
Colorado
Rhode Island
Missouri
Wisconsin
Tennessee
Oklahoma
Michigan
Kentucky
Connecticut
Massachusetts
Maryland
New Jersey
South Carolina
Nebraska
New York
Arkansas
Virginia
Oregon
Kansas
Arizona
Nevada
Utah
United States
Ohio
Minnesota
North Carolina
Mississippi
Tex a s
Hawaii
Florida
Iowa
Washington
New Mexico
Illinois
Wyoming
California
24%
64%
24%
26%
67%
Percentage of All Public Enrollment
in Two-Year Institutions
66%
30%
NOTE: Two-year institutions are dened as institutions where more than 50% of degrees/certicates awarded are associate degrees or certicates, even if they award
some bachelor’s degrees.
SOURCE: NCES, IPEDS Fall Enrollment data, 2010 and 2020; calculations by the authors.
Between fall 2010 and fall 2020, total enrollment declined by 20%
or more in six states and increased in six states.
Overall, two-year colleges, some of which oer a limited
number of bachelor’s degrees, accounted for half of the public
undergraduate enrollment in fall 2020. In ve states, this share
was 60% or more; in ve states, it was below 30%.
ALSO IMPORTANT:
Together, California and Texas enrolled 26% of the nation’s
students at public colleges and universities in fall 2020.
The graduate student share of total public enrollment in fall 2020
was 11%; it ranged from 6% in California to 17% in Alabama.
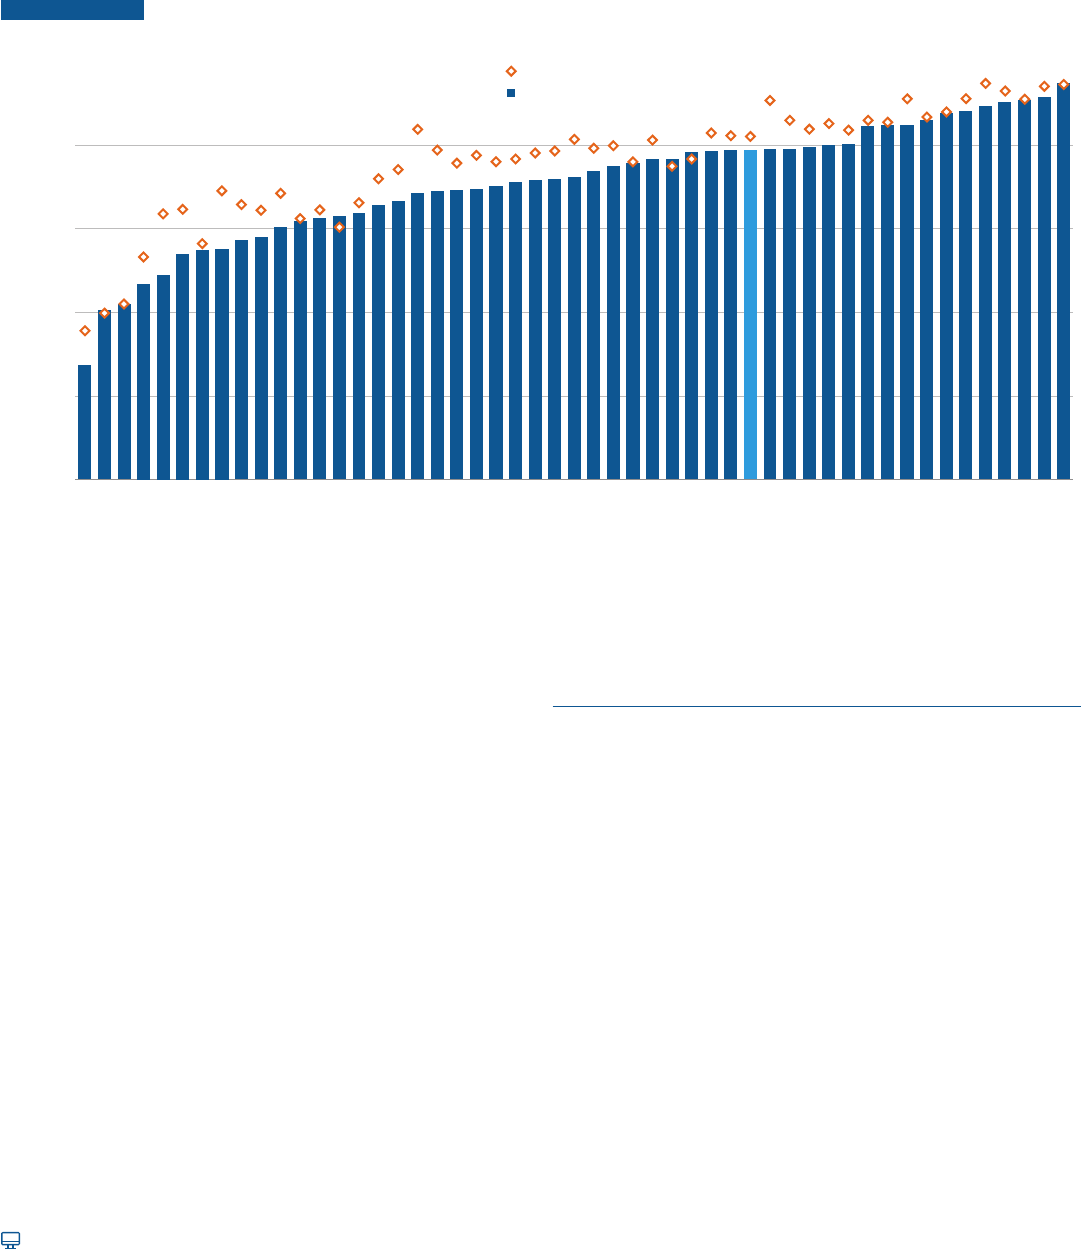
28
research.collegeboard.org/trends.
Migration
were enrolled declined from 82% in fall 2010 to 79% in fall 2020.
FIGURE CP-19
Percentage of First-Time Students
Who Were State Residents
80%
60%
40%
20%
0%
Fall 2010
94%
91%
Fall 2020
28%
41%
49%
55%
69%
79%
82%
91%
91%
95%
36%
64%
69%
84%
Vermont
Delaware
North Dakota
New Hampshire
Rhode Island
Mississippi
Wyoming
Montana
South Dakota
Arizona
Alabama
West Virginia
South Carolina
Iowa
Oregon
Hawaii
Idaho
Maine
Indiana
Oklahoma
Arkansas
Kentucky
Wisconsin
Kansas
Colorado
Utah
Pennsylvania
Missouri
Minnesota
New Mexico
Maryland
Virginia
Washington
Nebraska
United States
Tennessee
Ohio
Connecticut
Michigan
Nevada
Massachusetts
Louisiana
Illinois
North Carolina
Florida
Georgia
California
Alaska
New York
New Jersey
Texas
four-year institutions who were state residents ranged from 28%
in Vermont and 41% in Delaware to 91% in New York and New
Jersey and 95% in Texas.
Between 2010 and 2020, the percentage of students who were
state residents declined the most in Maine (from 84% to 69%),
Rhode Island (from 64% to 49%), and in Montana (69% to 55%).
four-year institutions who were state residents increased between
fall 2010 and fall 2020. The largest increases were 3 percentage
points (from 60% to 63%) in Iowa and 2 percentage points in
Maryland (from 75% to 77%).
ALSO IMPORTANT:
four-year colleges were from New Jersey, only 46% of state
residents who enrolled in a four-year college chose an in-state
four-year institution.
Most public colleges and universities charge higher tuition for
out-of-state students and can increase their tuition revenues by
enrolling more out-of-state students.
Many states have reciprocity agreements that allow students
to attend a college or university in a nearby state without being
charged the full out-of-state tuition.
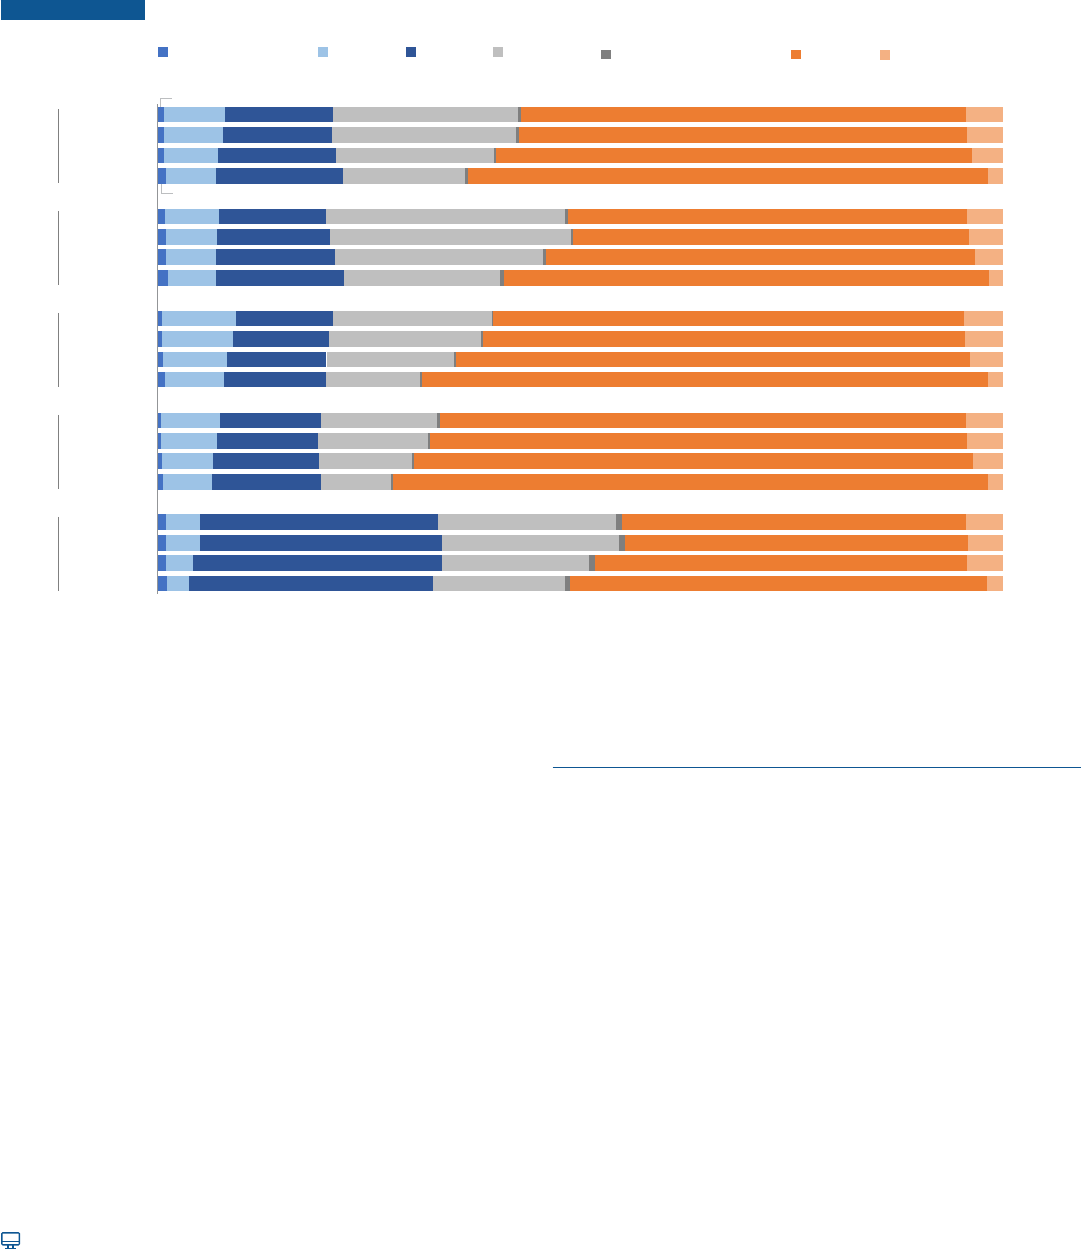
29
research.collegeboard.org/trends.
Enrollment by Race/Ethnicity
Between fall 2010 and fall 2020, the shares of undergraduate students who were Asian, Hispanic, or two or more
races increased while the shares of undergraduate students who were Black, White, or American Indian/Alaska
Native declined.
FIGURE CP-20
American Indian/ Asian Black Hispanic
Native Hawaiian/ White Two or
Alaska Native
Other Pacific Islander More Races
Private
Nonprofit Public Public
For-Profit Four-Year Four-Year Two-Year All
2020
2019
2015
2010
2020 (40%)
2019 (42%)
2015 (43%)
2010 (45%)
2020 (39%)
2019 (38%)
2015 (36%)
2010 (33%)
2020 (16%)
2019 (16%)
2015 (15%)
2010 (13%)
2020 (5%)
2019 (4%)
2015 (6%)
2010 (8%)
7.3%
6.9%
6.4%
5.9%
6.4%
6.1%
5.9%
5.7%
8.7%
8.3%
7.6%
7.0%
6.9%
6.5%
6.0%
5.7%
4.1%
4.0%
3.3%
2.7%
12.8%
13.0%
13.9%
15.0%
12.7%
13.3%
14.1%
15.2%
11.5%
11.3%
11.6%
12.1%
12.0%
11.9%
12.6%
13.0%
28.2%
28.7%
29.4%
28.8%
21.9%
21.8%
18.7%
14.5%
28.3%
28.5%
24.6%
18.5%
18.8%
18.1%
15.2%
11.1%
13.7%
13.0%
10.9%
8.3%
21.0%
21.0%
17.5%
15.7%
52.7%
53.1%
56.4%
61.6%
47.3%
46.9%
50.8%
57.5%
55.7%
57.0%
60.9%
67.0%
62.3%
63.6%
66.1%
70.4%
40.7%
40.5%
44.0%
49.4%
4.4%
4.2%
3.6%
1.7%
4.2%
3.9%
3.3%
1.6%
4.6%
4.5%
3.9%
1.7%
4.3%
4.2%
3.5%
1.8%
4.4%
4.1%
4.2%
1.8%
1.0%
0.7%
sector as a percentage of total undergraduate enrollment. Percentages may not sum to 100 because of rounding.
Hispanic students represented 18.5% of all undergraduates in the
public two-year sector in fall of 2010. The share of these students
in the public two-year sector increased to 24.6% in fall 2015 and to
28.3% in fall 2020.
Asian students represented 7% of all undergraduates in the public
four-year sector in fall of 2010. The share of these students in the
public four-year sector increased to 7.6% in fall 2015 and to 8.7% in
fall 2020.
White students represented 67% of all undergraduates in
the public four-year sector in fall of 2010. The share of these
students in the public four-year sector decreased to 60.9% in fall
2015 and to 55.7% in fall 2020.
In fall 2020, the share of undergraduates who are Black ranged
institutions.
ALSO IMPORTANT:
Hispanic students are disproportionately enrolled in public
two-year colleges. One reason for this is that states with large
have higher shares of students enrolled in the public two-year
In 2020, Hispanic students accounted for an estimated 25.3%
of all public high school graduates in the United States, up from
17.5% in 2010. The share of public high school graduates who are
White declined from 60.2% in 2010 to 50.1% in 2020. (Western
Knocking at the
College Door, 10
th
edition)
TRENDS IN HIGHER EDUCATION SERIES
Trends in
Student Aid
2022
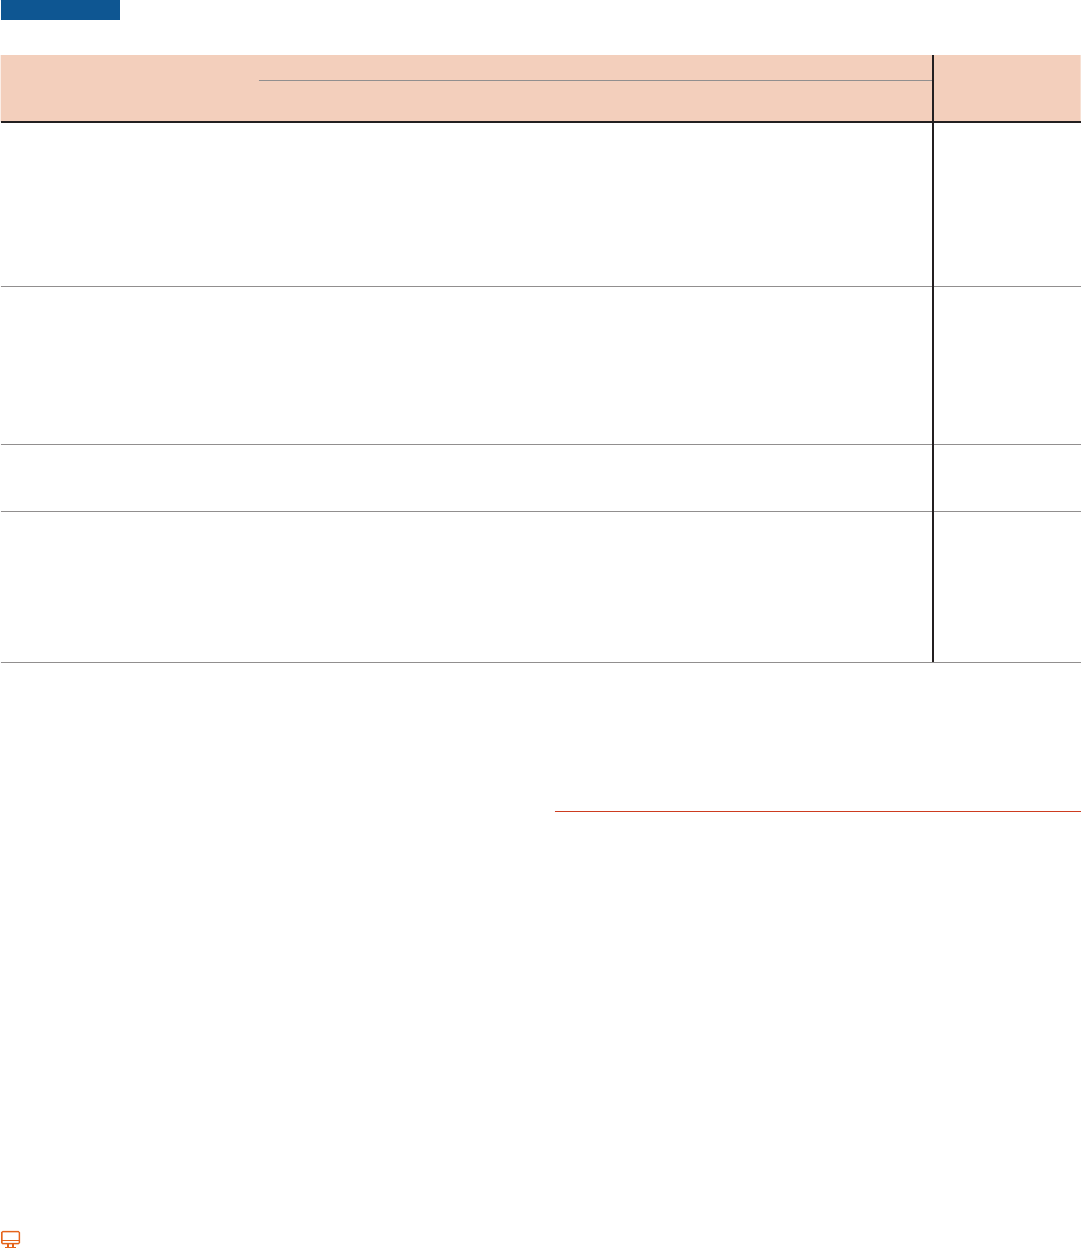
For detailed data behind the graphs and additional information, please visit: research.collegeboard.org/trends.
31
Total Student Aid
In 2021-22, undergraduate and graduate students received a total of $234.6 billion in student aid in the form
of grants, Federal Work-Study, federal loans, and federal tax credits and deductions.
TABLE SA-1 Total Student Aid and Nonfederal Loans in 2021 Dollars (in Millions), Undergraduate and Graduate Students Combined,
1991-92 to 2021-22, Selected Years
Academic Year
10-Year
% Change
30-Year
% Change91-92 01-02 11-12 16-17 17-18 18-19
19-20 20-21
Preliminary
21-22
Federal Aid
Grants
Pell Grants $11,525 $15,262 $40,446 $30,363 $31,695 $30,657 $30,119 $27,710 $25,865 -36% 124%
FSEOG $1,034 $1,057 $886 $828 $810 $906 $890 $905 $871 -2% -16%
LEAP $124 $84 — — — — — — — — —
Veterans' Benets $1,702 $2,450 $12,112 $13,599 $12,901 $12,880 $12,156 $11,025 $9,781 -19% 475%
Total Federal Grants $14,384 $18,853 $53,444 $44,790 $45,407 $44,442 $43,165 $39,639 $36,518 -32% 154%
Loans
Perkins Loans $1,726 $1,896 $1,143 $1,001 $697 — — — — — —
Subsidized $18,823 $26,609 $48,878 $24,447 $23,112 $21,383 $19,970 $17,337 $15,444 -68% -18%
Unsubsidized — $22,463 $56,567 $56,357 $53,914 $51,709 $50,741 $48,505 $43,805 -23% —
Parent PLUS $1,998 $6,307 $13,343 $14,189 $14,092 $13,800 $13,093 $10,515 $10,402 -22% 421%
Grad PLUS — — $9,010 $10,890 $11,380 $11,589 $11,888 $12,305 $12,375 37%
—
Total Federal Loans $22,547 $57,275 $128,940 $106,883 $103,195 $98,481 $95,422 $88,663 $82,026 -36% 264%
Federal Work-Study $1,183 $1,535 $1,171 $1,108 $1,085 $1,208 $1,177 $1,174 $1,143 -2% -3%
Education Tax Benets — $7,800 $24,300 $18,060 $16,110 $14,600 $13,320 $12,220 $10,830 -55% —
Total Federal Aid $38,114 $85,463 $207,856 $170,840 $165,796 $158,731 $153,084 $141,696 $130,516 -37% 242%
State Grants $3,967 $7,865 $11,320 $12,406 $13,195 $13,337 $13,733 $13,510 $12,978 15% 227%
Institutional Grants $14,106 $25,919 $50,187 $65,375 $68,339 $70,690 $73,031 $74,437 $74,352 48% 427%
Private and Employer Grants $4,810 $9,810 $16,970 $17,910 $18,280 $18,390 $18,270 $17,300 $16,760 -1% 248%
Total Federal, State,
Institutional, and Other Aid $60,997 $129,057 $286,332 $266,532 $265,610 $261,149 $258,117 $246,943 $234,607 -18% 285%
Nonfederal Loans — $9,500 $10,000 $12,800 $13,200 $14,100 $15,300 $12,600 $12,700 27% —
Total Student Aid and Nonfederal Loans $60,997 $138,557 $296,332 $279,332 $278,810 $275,249 $273,417 $259,543 $247,307 -17% 305%
NOTE: Table SA-1 does not include the Higher Education Emergency Relief Fund, a variety of small federal grant and loan programs, as well as some small programs for
veterans and members of the military. Federal Supplemental Educational Opportunity Grant (FSEOG) and Federal Work-Study (FWS) funds reect federal allocations
and do not include the required matching funds from institutions. Tax benets, private and employer grants, and nonfederal loans are estimated. The data on 2021-22
institutional grant aid and state grant aid are estimated. Components may not sum to totals because of rounding.
SOURCE: See page 51 for Table SA-1 data sources.
The federal government’s share of total student aid decreased
from 73% in 2011-12 to 56% in 2021-22.
Between 2011-12 and 2021-22, total grant aid for postsecondary
students rose by 7% (in ination-adjusted dollars) to $140.6 billion.
Institutional grants grew most rapidly, increasing by 48% to an
estimated $74.4 billion in 2021-22.
Between 2011-12 and 2021-22, total federal loans declined by 36%
(in ination-adjusted dollars) to $82.0 billion.
ALSO IMPORTANT:
In 2021-22, undergraduate students received 74% ($174.4 billion)
of total student aid, including 96% of all federal grants and 52% of
federal loans. They received 86% of total grant aid from all sources
and 57% of all loans, including nonfederal loans. The remainder of
the aid funded graduate students. (Table SA-1 online)
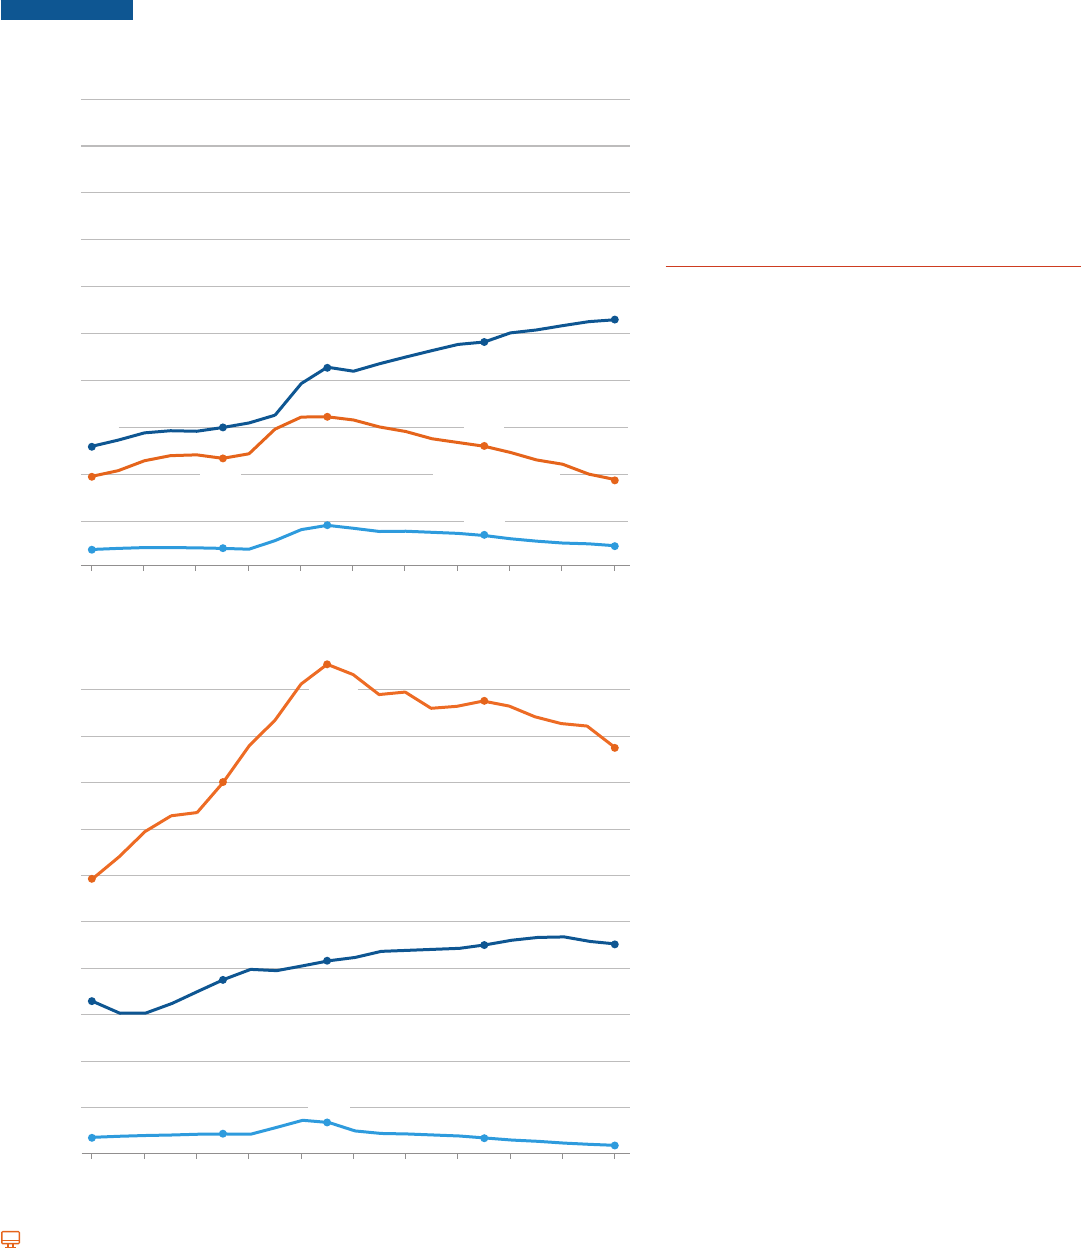
Aid per Student
by 37% (from $6,650 to $9,120 in 2021 dollars).
FIGURE SA-1
2001-02 to 2021-22
Undergraduate Students
$20,000
$18,000
$16,000
$14,000
$12,000
$10,590
$10,000
$8,000
$6,000
$4,000
$3,910
$1,820
$2,000
$1,390
$800
$840
$960
Average Other Aid
$0
01-02 03-04 05-06 07-08 09-10 11-12 13-14 15-16 17-18 19-20 21-22
Graduate Students
$20,000
$18,000
$16,000
$14,000
$12,000
$11,930
$10,000
Average Grant Aid
$9,090
$9,120
$8,000
$8,400
$6,650
$7,610
$6,000
Average Aid in 2021 Dollars Average Aid in 2021 Dollars
$5,990
$8,570
$9,640
$6,450
$3,780
Average Grant Aid
$5,190
$5,190
Average Federal Loans
$4,680
Average Federal Loans
$16,090
$19,630
$17,680
$21,230
$4,000
$2,000
$1,480
$0
01-02 03-04 05-06 07-08 09-10 11-12 13-14 15-16 17-18 19-20 21-22
Average Other Aid
$850
$990
$820
$500
in 2010-11 for both undergraduate and graduate
student declined to $3,780 in 2021-22, from a peak
2021-22, from a peak of $21,230 in 2010-11.
ALSO IMPORTANT:
In 2021-22, most of the “Other Aid” for both
undergraduate and graduate students was from
education tax credits and deductions. About 10%
Loans reported here include only federal loans to
students and parents. Grants from all sources are included.
“Other Aid” includes federal education tax credits and
graduate shares of some forms of aid are estimates based on
NPSAS data. Dollar values are rounded to the nearest $10.
Table SA-3 online. Please see page 51 for Table SA-3
data sources.
research.collegeboard.org/trends.
32
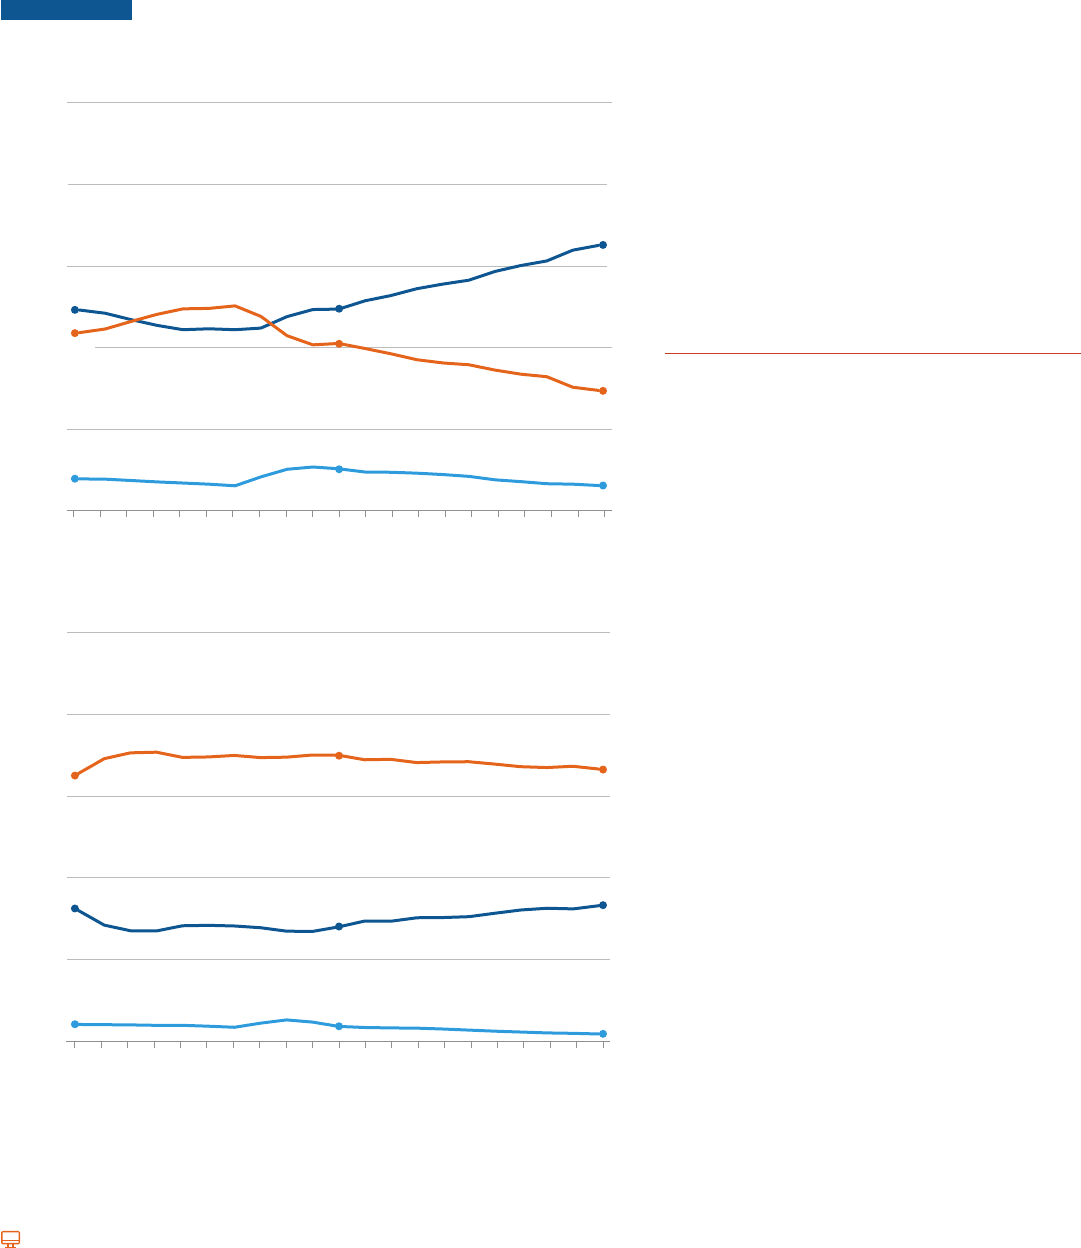
Grants, Loans, and Other Aid
Loans (including both federal and nonfederal) fell from 41% of the funds undergraduate students used to
supplement their own and their family resources in 2011-12 to 29% in 2021-22.
FIGURE SA-2 Composition of Total Aid and Nonfederal Loans,
2001-02 to 2021-22
Percentage of Total Funds Percentage of Total Funds
100%
Undergraduate Students
80%
60%
49%
Loans
49%
65%
40%
43%
Grants
41%
20%
8%
Other Aid
10%
29%
6%
0%
01-02 03-04 05-06 07-08 09-10 11-12 13-14 15-16 17-18 19-20 21-22
100%
Graduate Students
80%
64%
Loans
69%
66%
60%
40%
32%
Grants
28%
33%
20%
4%
Other Aid
4%
2%
0%
01-02 03-04 05-06 07-08 09-10 11-12 13-14 15-16 17-18 19-20 21-22
Nonfederal loans are included to show the total education borrowing by students
deductions. Percentages may not sum to 100 because of rounding.
Table SA-4 online. Please see page 51 for Table SA-4 data sources.
Grants rose from 49% of total funding in 2011-12 to
65% in 2021-22 for undergraduate students.
Between 2001-02 and 2021-22, loans consistently
made up 64% to 70% of the funds graduate students
their studies.
Grants have been the source of 26% to 33% of
funding for graduate students over this 20-year
period.
student aid and nonfederal loans for undergraduate
students and 2% for graduate students.
ALSO IMPORTANT:
increased by 5% and total loan volume fell by 43%
between 2011-12 and 2021-22, after adjusting for
by 14% and total loan volume fell by 9% between
2011-12 and 2021-22.
(Table SA-1 online)
research.collegeboard.org/trends.
33
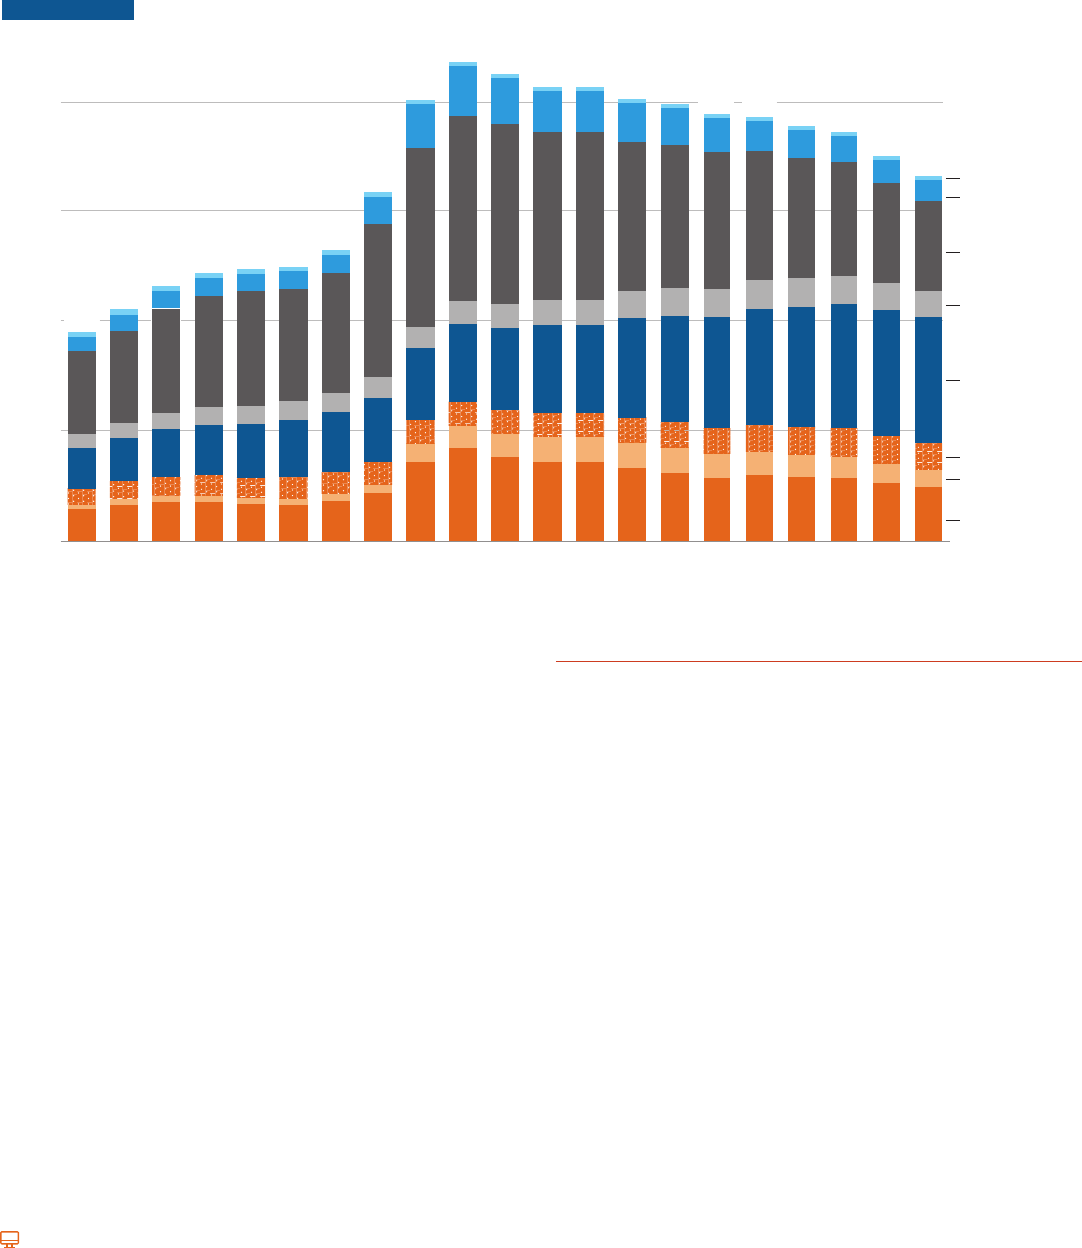
34
Total Undergraduate Student Aid by Type
declined to $174.4 billion in 2021-22.
FIGURE SA-3 Total Undergraduate Student Aid in 2021 Dollars by Source and Type (in Billions), 2001-02 to 2021-22
$230.0
Billions of 2021 Dollars
$200
15%
16%
15%
15%
14%
13%
14%
14%
18%
19%
18%
17%
17%
17%
16%
15%
16%
15%
15%
15%
15%
5%
4%
5%
6%
6%
6%
6%
6%
5%
6%
5%
5%
5%
8%
8%
7%
7%
7%
8%
7%
6%
5%
5%
5%
5%
6%
6%
6%
7%
7%
7%
19%
18%
19%
19%
20%
21%
21%
18%
16%
16%
18%
20%
21%
23%
24%
26%
27%
29%
30%
33%
35%
7%
7%
7%
7%
7%
7%
7%
6%
5%
5%
5%
5%
6%
6%
6%
7%
7%
7%
7%
7%
7%
39%
40%
41%
42%
42%
41%
41%
44%
40%
38%
38%
37%
36%
34%
33%
32%
30%
29%
28%
26%
25%
7%
7%
$100.2
5%
7%
7%
7%
7%
6%
6%
8%
10%
10%
10%
9%
9%
9%
9%
8%
7%
7%
6%
6%
6%
$121.9
$128.2
$130.1
$131.7
$139.6
$167.4
$211.8
$110.7
$223.2
$217.0
$214.9
$211.3
$208.8
$202.7
$198.4
$195.3
$184.0
$174.4
01-02 02-03 03-04 04-05 05-06 06-07 07-08 08-09 09-10 10-11 11-12 12-13 13-14 14-15 15-16 16-17 17-18 18-19 19-20 20-21 21-22
$203.9
6%
FWS and FSEOG
Federal Education
$150
Tax Benefits
Federal Loans
Private and
$100
Employer Grants
Institutional
Grants
$50
State Grants
Federal Veterans’
Benefits
Federal Pell
$0
Grants
Percentages may not sum to 100 because of rounding.
Table SA-1 online. Please see page 51 for Table SA-1 data sources.
Between 2011-12 and 2021-22, institutional grant aid increased
by 53% ($20.9 billion in 2021 dollars).
Between 2011-12 and 2021-22, federal loans declined by 50%
($42.9 billion in 2021 dollars) and federal Pell Grants declined by
36% ($14.6 billion in 2021 dollars).
ALSO IMPORTANT:
Between 2011-12 and 2021-22, full-time equivalent undergraduate
enrollment decreased by 16% while total grant aid to undergraduate
students increased by 5% and total aid (including grants, loans, and
other aid) decreased by 22%. Over this decade, average grant aid
per undergraduate student increased by 26% ($2,190) and average
total aid per undergraduate student decreased by 7% ($1,090).
(Table SA-3 online)
research.collegeboard.org/trends.

Total Graduate Student Aid by Type
stable at about $61 billion to $63 billion between 2011-12 and 2020-21. It then slightly declined to
$60.3 billion in 2021-22.
FIGURE SA-4 Total Graduate Student Aid in 2021 Dollars by Source and Type (in Billions), 2001-02 to 2021-22
$64.3
Billions of 2021 Dollars
$60
$50
$40
$30
$20
$10
$0
$60.5
5%
3%
$63.1
3%
18%
9%
67%
3%
$61.3
3%
18%
8%
67%
3%
$61.9
3%
19%
8%
66%
3%
$60.8
3%
19%
7%
66%
3%
$61.5
3%
20%
7%
66%
3%
$62.7
3%
21%
7%
66%
$62.9
3%
21%
7%
65%
$62.7
3%
22%
7%
65%
$62.8
3%
2%
22%
23%
7%
7%
65%
65%
$62.9
$60.3
12-13 13-14 14-15 15-16 16-17 17-18 18-19 19-20 20-21 21-22
22%
10%
61%
4%
20%
10%
65%
4%
$31.7
18%
9%
66%
4%
$35.0
18%
10%
66%
4%
$38.0
19%
11%
65%
4%
$39.8
18%
11%
65%
4%
$44.0
17%
12%
66%
3%
17%
11%
67%
4%
$53.5
16%
9%
68%
5%
16%
9%
68%
17%
9%
68%
01-02 02-03 03-04 04-05 05-06 06-07 07-08 08-09 09-10 10-11 11-12
$49.0
$28.9
Federal
Work-Study
Federal
Education
Tax Benefits
Federal Loans
Private and
Employer Grants
Institutional
Grants
State Grants
Federal Veterans’
Benefits
Percentages may not sum to 100 because of rounding.
Table SA-1 online. Please see page 51 for Table SA-1 data sources.
students, peaking at 68% of the total funding from 2009-10 to
2011-12. In 2021-22, 65% of total funding for graduate students is
from federal loans.
Between 2001-02 and 2011-12, federal loans for graduate
students more than doubled, increasing from $17.7 billion to $43.1
by 9% over the next decade to $39.0 billion in 2021-22.
Institutional grants are the second largest funding source for
graduate students. Between 2001-02 and 2011-12, institutional
grants for graduate students rose by 65%, from $6.5 billion to
$10.7 billion in 2021 dollars. Institutional grants grew by another
32% over the next decade to $14.1 billion in 2021-22.
ALSO IMPORTANT:
Between 2011-12 and 2021-22, full-time equivalent graduate
enrollment increased by 7% while total grant aid to graduate
students increased by 14% and total aid (including grants, loans,
and other aid) decreased by 4%. Over this decade, average grant
aid per graduate student increased by 7% ($570) and average
total aid per graduate student decreased by 10% ($3,160).
(Table SA-3 online)
research.collegeboard.org/trends.
35
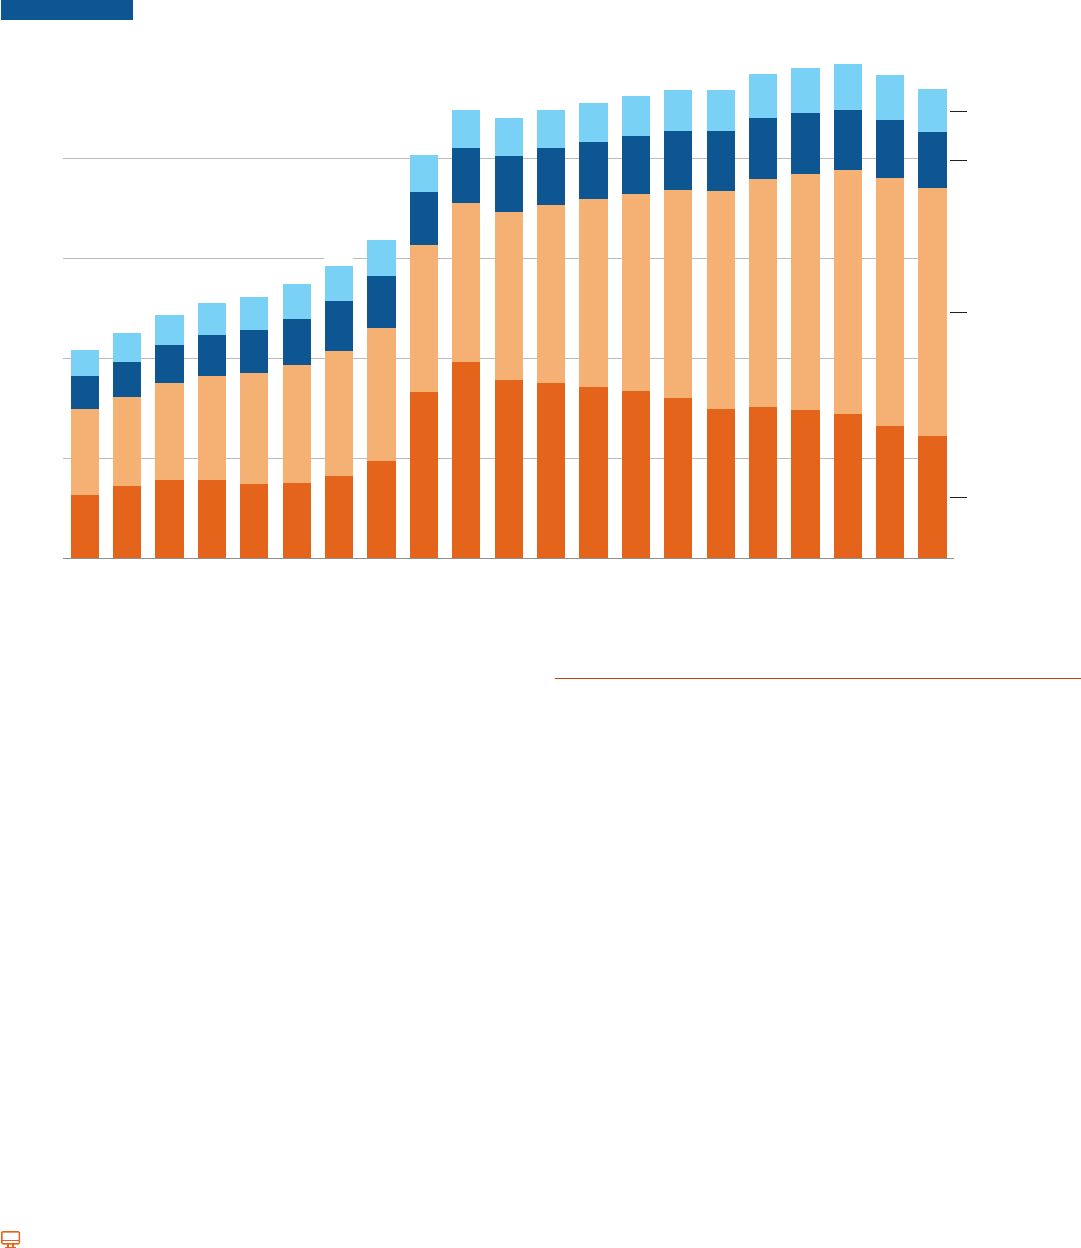
36
Sources of Grant Aid
The total amount of grant aid supporting postsecondary students increased by 111% (after adjusting for
total of $140.6 billion.
FIGURE SA-5 Total Grant Aid in 2021 Dollars by Source of Grant, 2001-02 to 2021-22
Grants in Billions of 2021 Dollars
$120
$90
$60
$30
$0
30%
42%
16%
13%
$62.4
32%
39%
16%
13%
$67.6
32%
40%
16%
12%
$72.9
31%
41%
16%
13%
$76.4
29%
42%
17%
12%
$78.3
28%
43%
17%
13%
$82.1
28%
43%
17%
12%
30%
42%
16%
11%
$95.4
41%
37%
13%
9%
$120.9
44%
35%
12%
9%
$134.4
41%
38%
13%
9%
$131.9
39%
40%
13%
8%
$134.2
38%
41%
13%
8%
$136.4
36%
43%
12%
9%
$138.6
34%
45%
13%
9%
$140.4
32%
47%
13%
9%
$140.5
31%
47%
13%
9%
$145.2
30%
48%
13%
9%
29%
49%
12%
9%
27%
51%
12%
9%
$144.9
26%
53%
12%
9%
$140.6
01-02 02-03 03-04 04-05 05-06 06-07 07-08 08-09 09-10 10-11 11-12 12-13 13-14 14-15 15-16 16-17 17-18 18-19 19-20 20-21 21-22
$87.5
$148.2
$146.9
State Grants
Private and
Employer
Grants
Institutional
Grants
Federal Grants
Percentages may not sum to 100 because of rounding.
Between 2011-12 and 2021-22, institutional grant aid rose by
$24.2 billion (in 2021 dollars) reaching a total of $74.4 billion in
2021-22. Institutional grants accounted for 53% of all grant aid
for undergraduate and graduate students in 2021-22.
In 2001-02, federal grants constituted 30% of total grant aid
for undergraduate and graduate students. This share peaked at
44% in 2010-11 and declined to 26% in 2021-22.
Since 2009-10, state grant aid was between 8% and 9% of all
grant aid. Total state grant aid grew by 44% (after adjusting for
15%
over the decade ending in 2021-22.
Grants from employers and other private sources were between
12% and 17% of total grant aid to postsecondary students for
the entire two decades from 2001-02 through 2021-22 and were
12% of the total in 2021-22.
ALSO IMPORTANT:
Grant aid for veterans increased from 23% of federal grant aid
in 2011-12 to 27% in 2021-22. At the same time, Pell Grants
decreased from 76% to 71% of the total. (Table SA-1 online)
and graduate students combined. In 2021-22, 7% of graduate
student grant aid came from the federal government in the form
of aid to veterans, 70% from institutions, 21% from employers and
students, the percentages were 29% federal, 50% institutional,
10% private and employer, and 10% state. (Table SA-1 online)
research.collegeboard.org/trends.
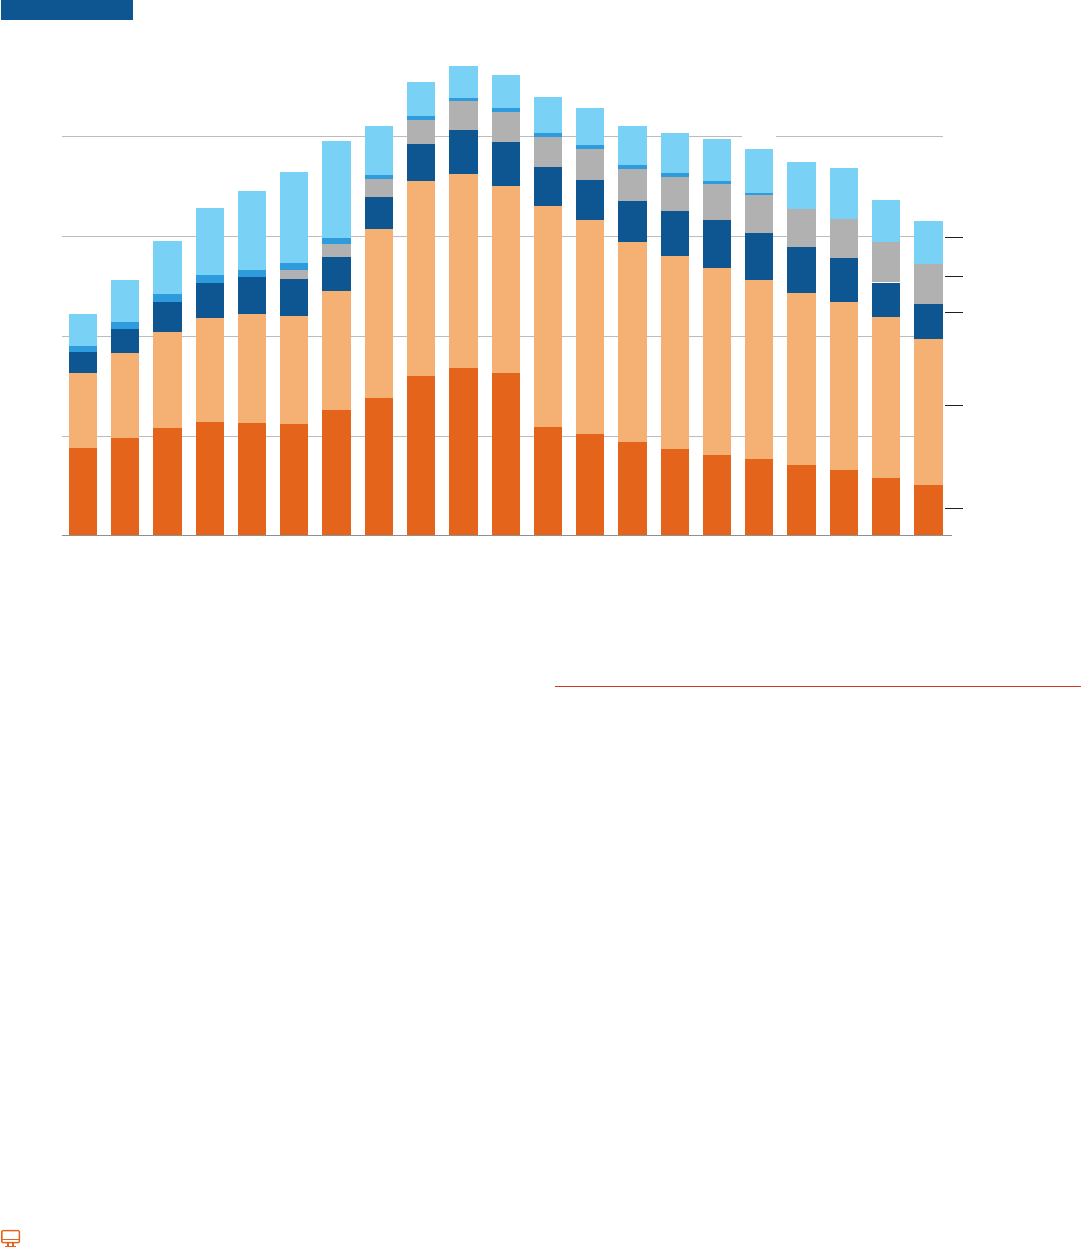
Types of Loans
Total education borrowing declined for the 11th consecutive year in 2021-22. Between 2020-21 and 2021-
FIGURE SA-6
$141.6
$120
$90
01-02 02-03 03-04 04-05 05-06 06-07 07-08 08-09 09-10 10-11 11-12 12-13 13-14 14-15 15-16 16-17 17-18 18-19 21-2220-2119-20
40%
38%
37%
35%
33%
31%
32%
34%
35%
36%
35%
25%
24%
23%
22%
20%
20%
19%
18%
17%
16%
34%
33%
32%
32%
32%
30%
30%
41%
43%
41%
41%
50%
50%
49%
48%
47%
46%
46%
46%
46%
48%
9%
10%
10%
11%
11%
10%
8%
8%
8%
9%
10%
9%
9%
10%
11%
11%
12%
12%
12%
12%
10%
4%
5%
6%
6%
7%
7%
8%
8%
9%
10%
10%
11%
12%
14%
16%
18%
20%
23%
25%
25%
12%
7%
7%
7%
8%
9%
9%
10%
11%
11%
13%
14%
12%
13%
13%
$66.8
$76.9
$88.8
$98.6
$94.7
$103.9
$109.5
$118.9
$123.4
$136.6
$138.9
$132.1
$129.0
$123.3
$121.4
$119.7
$112.6
$110.7
$101.3
$116.4
Nonfederal Loans
Grad PLUS Loans
Parent PLUS
Loans
$60
Federal
Unsubsidized
$30
Loans
Federal
Subsidized
Loans
$0
Loans in Billions of 2021 Dollars
Nonfederal loans include loans to students from states and institutions in addition to private loans issued by banks, credit unions, and other lenders. Values for
nonfederal loans are estimates and are less precise than federal loan amounts. The dark blue segment that ended in 2017-18 represents Perkins Loans.
Total annual student and parent borrowing for postsecondary
education reached its peak of $141.6 billion (in 2021 dollars) in
2010-11. It then declined by 33% ($46.9 billion in 2021 dollars) to
$94.7 billion in 2021-22.
Between 2010-11 and 2021-22, federal Direct subsidized and
unsubsidized student loans fell by $49.8 billion (46%) and borrowing
through parent PLUS declined by $2.8 billion (21%). Total Grad PLUS
borrowing increased by $3.7 billion (43%) over this period.
Students borrow nonfederal education loans from banks, credit
unions, and other private lenders, including some states and
postsecondary institutions. These loans, which are not part of the
student aid system and typically do not involve subsidies, fell from
about $29 billion (in 2021 dollars) in 2007-08 to $10 billion in
20 09-10, before increasing to about $13 billion in 2021-22.
Nonfederal loans accounted for about 13% of all education loans
in 2021-22.
ALSO IMPORTANT:
There are no credit requirements for subsidized and
unsubsidized Direct Loans. To qualify for PLUS loans, borrowers
or more delinquent on any debts greater than $2,085 or being
the subject of default determination, bankruptcy discharge,
foreclosure, repossession, tax lien, wage garnishment, or write-
date of the credit report.
research.collegeboard.org/trends.
37
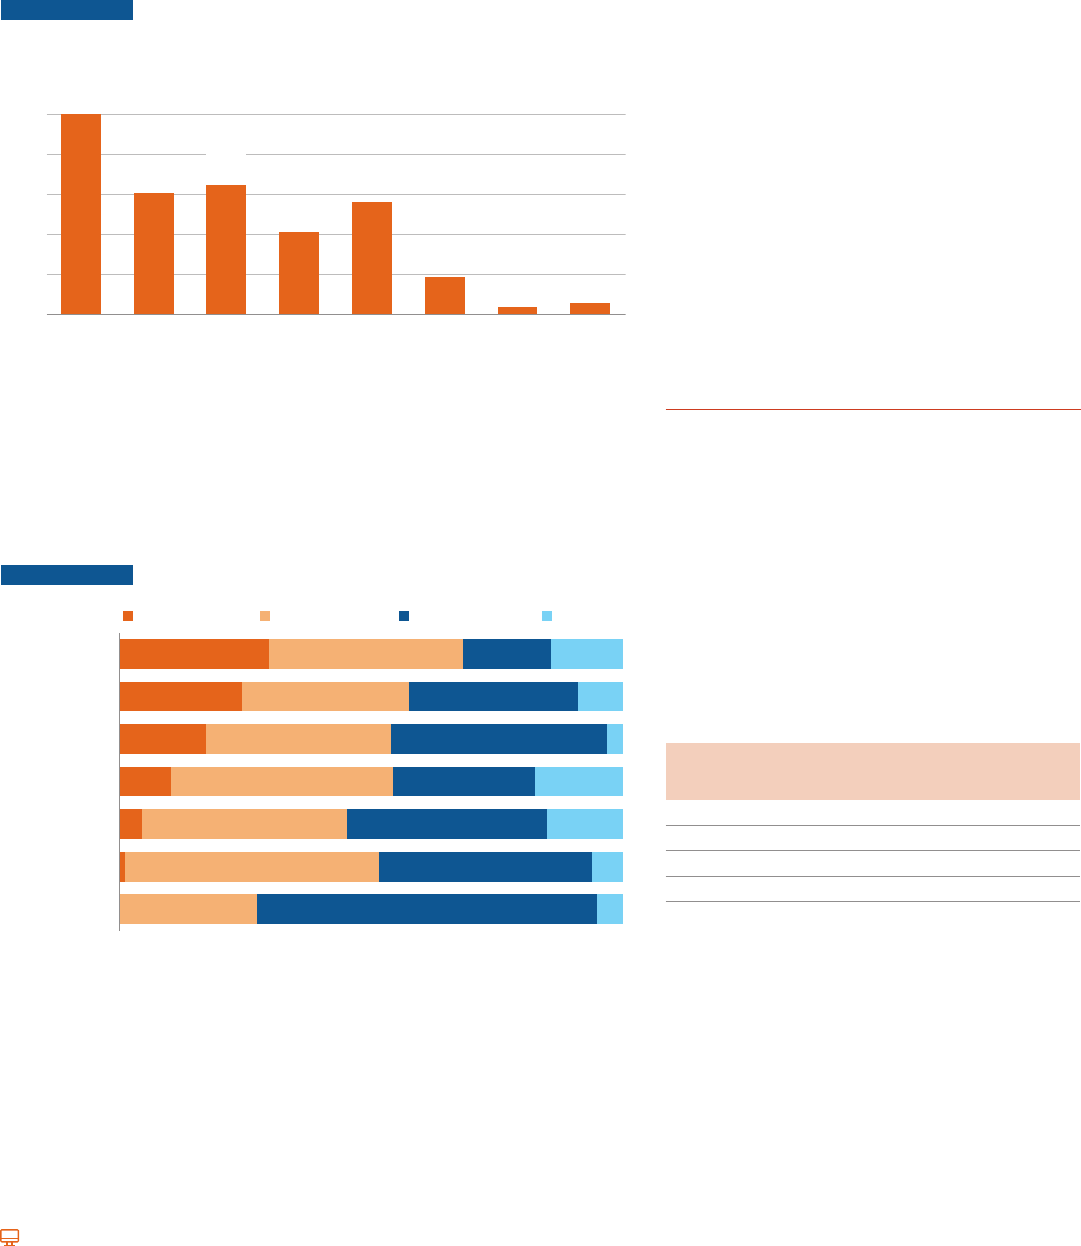
38
Federal Aid
$4,250 per Pell Grant recipient. There were 6.1 million Pell Grant recipients compared with 562,000
FIGURE SA-7
Received), 2021-22
10.0
million
10
8
6
4
2
0
6.1
million
6.5
million
5.6
million
4.1
million
1.9
million
372,000
562,000
Estimated Federal Direct Direct Direct FSEOG Federal Post/9-11
Federal Pell Subsidized Subsidized Unsubsidized ($780) Work-Study GI Bill
Education Tax Grant and Loans Loans ($1,890) Veterans’
Benefits ($4,250) Unsubsidized ($3,760) ($7,780) Benefits
($1,330) Loans ($14,770)
($9,170)
Federal Aid Programs (with Average Aid per Recipient)
Number of Recipients (in Millions)
2020-21 and represent federal funds only. Institutions provide matching funds so the awards that
students receive under these programs are larger than these federal aid amounts.
FIGURE SA-8
Public Two-Year Public Four-Year Private Nonprofit For-Profit
Pell Grants
FSEOG
Federal
Work-Study
Direct
Subsidized Loans
Direct
Unsubsidized Loans
Parent
PLUS Loans
Grad PLUS Loans
30% 38% 17% 14%
24%
33%
34%
9%
17%
37%
43%
3%
10%
44%
28%
17%
4%
41%
40%
15%
50%
42%
6%
27%
67%
5%
enrolled in foreign institutions. Percentages may not sum to 100 because of rounding.
In 2021-22, the total number of borrowers in
the subsidized and unsubsidized Direct Loan
programs was 6.5 million—less than the sum of
the number of recipients in each program because
about half of borrowers participated in both
programs.
In 2020-21, public two-year college students,
undergraduate enrollment, received 30% of Pell
Grant funds.
sector accounted for 20% of undergraduate, 45%
enrollment. They received 67% of Grad PLUS
loans, 42% of Parent PLUS loans, and 43% of
.
ALSO IMPORTANT:
are for undergraduates only. Grad PLUS loans are
for graduate students only. Parent PLUS loans
Direct Unsubsidized loans, and Post-9/11 GI Bill
graduate students.
Undergraduate
Students
Graduate
Students
Students
Public Two-Year 29% 0% 25%
44% 48% 45%
20% 45% 24%
7% 7% 7%
research.collegeboard.org/trends.
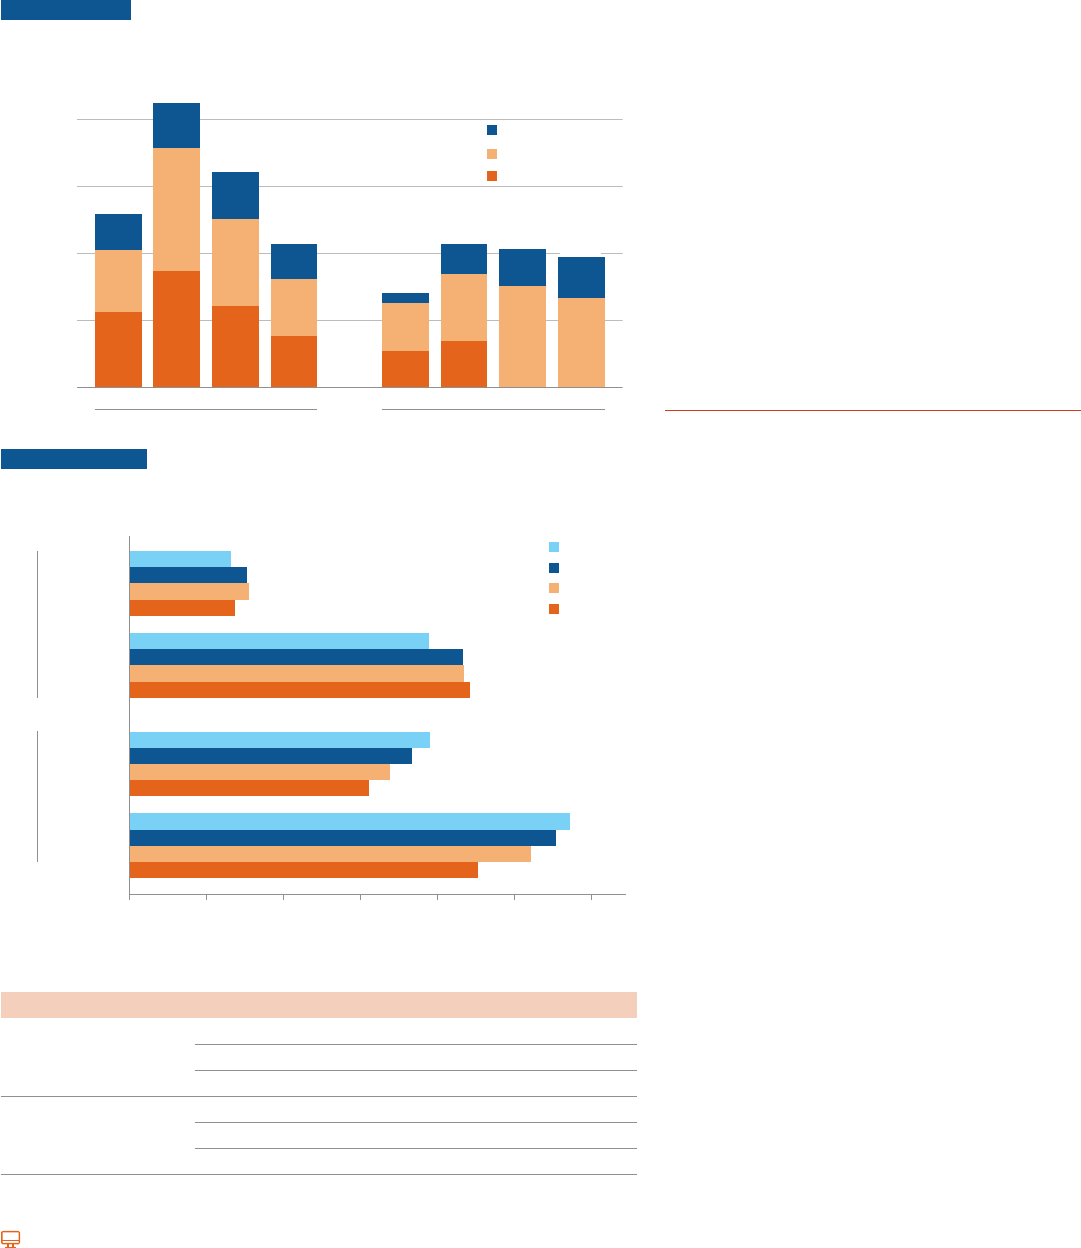
Federal Loans: Annual Borrowing
After rapid growth in annual borrowing between 2006-07 and 2011-12, total federal loans to undergraduate
students declined by 49% ($42.0 billion in 2021 dollars) and total federal loans to graduate students
decreased by 9% ($3.8 billion) between 2011-12 and 2021-22.
FIGURE SA-9A
Unsubsidized, and PLUS Loans in Billions of 2021 Dollars,
2006-07 to 2021-22, Selected Years
Undergraduate Graduate
$51.9
$85.0
$64.5
$43.0
$28.2
$42.8
$41.4
$39.0
$0
$20
$40
$60
$80
2006-07 2011-12 2016-17 2021-22 2006-07 2011-12 2016-17 2021-22
Total Annual Amount Borrowed
in Millions of 2021 Dollars
PLUS
Unsubsidized
Subsidized
$22.6
$18.3
$10.9
$34.9
$36.7
$13.3
$24.5
$25.9
$14.2
$15.4
$17.2
$11.0
$14.4
$30.5
$10.9
$26.7
$12.4
$14.0
$19.8
$9.0
$10.4
FIGURE SA-9B
Unsubsidized, and PLUS Loans in 2021 Dollars, 2006-07
to 2021-22, Selected Years
2021-22
$6,440
2016-17
$7,420
Undergraduate
2011-12
$7,540
$6,700
2006-07
$18,970
$21,120
Graduate
$21,180
$21,560
$19,060
$17,890
Undergraduate
$16,480
$15,140
$27,930
$27,040
Graduate
$25,410
$22,060
$0 $5,000 $10,000 $15,000 $20,000 $25,000 $30,000
Average Annual Amount Borrowed in 2021 Dollars per Borrower
Subsidized and
PLUS Unsubsidized
Number of Borrowers (in Thousands), 2006-07 to 2021-22, Selected Years
2006-07 2011-12 2016-17 2021-22
Subsidized and Unsubsidized
Undergraduate 6,111 9,505 6,781 5,059
Graduate 1,177 1,596 1,445 1,405
TOTAL 7,288 11,101 8,227 6,463
PLUS Undergraduate 722 810 793 546
Graduate 127 355 403 443
TOTAL 849 1,164 1,196 989
The share of annual federal education loans going
to graduate students (who constitute about 16%
of all postsecondary students) rose from 35%
($28.2 b
illion out of $80.1 billion in 2021 dollars) in
2006-07 to 48% ($39.0 billion out of $82.0 billion)
in 2021-22.
In 2021-22, undergraduates taking subsidized
and/or unsubsidized loans borrowed an average
of $6,440—$1,100 less (in 2021 dollars) than a
decade earlier and $980 less than in 2016-17.
In 2021-22, 443,000 graduate students borrowed
borrowed unsubsidized loans. The average
amount borrowed through the PLUS program was
$8,960 higher than the average unsubsidized loan
($27,930 vs. $18,970).
ALSO IMPORTANT:
The aggregate federal student loan limit for
dependent undergraduate students is $31,000.
No more than $23,000 can be subsidized loans.
Independent s
tudents and dependent students
whose parents are not eligible for parent PLUS
loans c
an borrow an additional $26,500 in
unsubsidized loans.
Graduate and professional students can borrow up
to a lifetime total of $138,500 from the subsidized
and unsubsidized loan programs, including their
are enrolled, they can borrow up to the full cost
of attendance not covered by grant aid, including
living expenses and books and supplies in addition
to tuition and fees through the grad PLUS program.
Like the grad PLUS program, the parent PLUS
progra
m allows borrowing to cover students’ entire
budgets less grant aid received for an unlimited
number of
years of enrollment.
Graduate students became eligible to borrow PLUS Loans
because of rounding.
Table SA-6 online. Please see page 51 for Table SA-6
data sources.
research.collegeboard.org/trends.
39
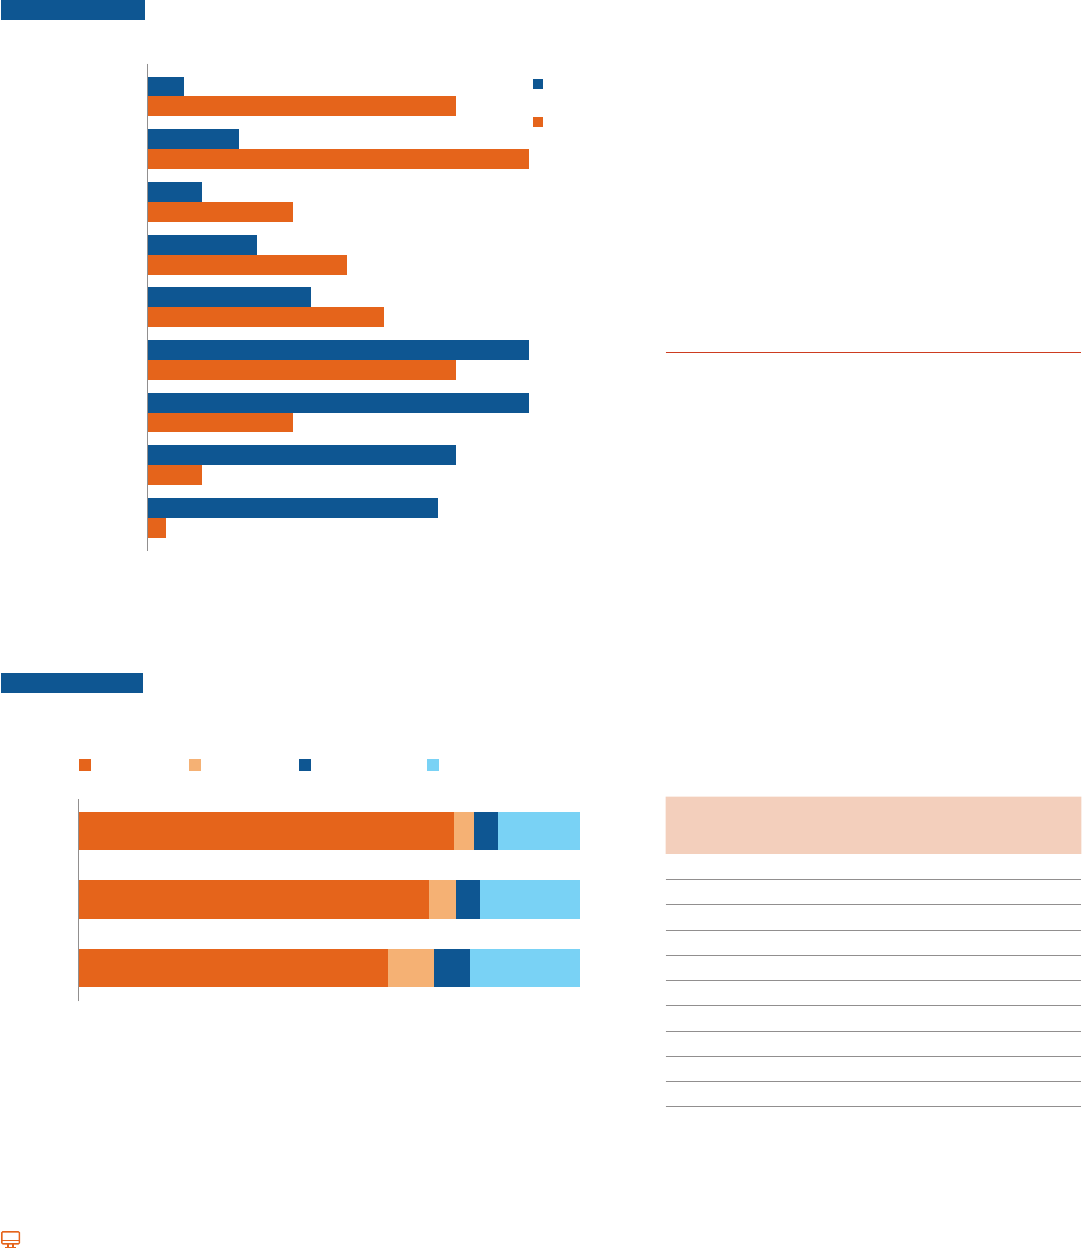
40
For detailed data behind the graphs and additional information, please visit: research.collegeboard.org/trends.
Federal Loans: Borrowing and Balances
As of March 2022, 33% of borrowers owed less than $10,000 in federal loan debt. These borrowers held
4% of the outstanding federal debt.
FIGURE SA-10 Distribution of Borrowers and Debt by Outstanding Balance,
Second Quarter of FY2022
Percentage
of Borrowers
Percentage
of Debt
Outstanding Borrower Debt Balance
9%
13%
$40,000 to $59,999
2%
17%
$200,000 or More
5%
21%
$100,000 to $199,999
3%
8%
$80,000 to $99,999
6%
11%
$60,000 to $79,999
21%
17%
$20,000 to $39,999
21%
8%
$10,000 to $19,999
17%
3%
$5,000 to $9,999
16%
1%
Less than $5,000
NOTE: Includes both loans made under the Federal Direct Loan Program (FDLP) and the Federal
Family Education Loan (FFEL) Program, which ended in 2009-10. Data were as of March 31, 2022,
the end of the second quarter of FY2022. Percentages may not sum to 100 because of rounding.
SOURCE: U.S. Department of Education, Federal Student Aid Center, Federal Student Loan Portfolio.
FIGURE SA-11 Percentage of Undergraduate Students Borrowing Federal
Subsidized and Unsubsidized Student Loans, 2011-12, 2016-17,
and 2021-22
4%75% 5% 16%
5%70% 5% 20%
9%62% 7% 22%
Percentage of Undergraduate Students
Academic Year
Both Subsidized and
Unsubsidized Loans
Unsubsidized
Only
Subsidized
Only
No Loans
2011-12
2016-17
2021-22
NOTE: IPEDS headcount enrollments are adjusted for the dierence between total headcount,
which counts students more than once if they are enrolled in more than one institution at the same
time, and unduplicated headcount reported by the National Student Clearinghouse (NSC).
Twelve-month undergraduate headcount for 2021-22 is estimated from the NSC data.
Percentages may not sum to 100 because of rounding.
SOURCE: NCES, IPEDS 12-month enrollment data; National Student Clearinghouse, Current Term
Enrollment Estimates: Spring 2022; U.S. Department of Education, Federal Student Aid Data Center,
Title IV Program Volume Reports and Aid Recipients Summary; calculations by the authors.
As of March 2022, 21% of borrowers owed
between $10,000 and $20,000. These borrowers
held 8% of the outstanding federal debt.
As of March 2022, 46% of the outstanding federal
education loan debt was held by 10% of borrowers
owing $80,000 or more.
In 2021-22, 25% of undergraduate students
borrowed Federal Direct student loans, down from
30% in 2016-17 and 38% in 2011-12.
In 2021-22, 4% of undergraduate students
borrowed subsidized loans only, 5% borrowed
unsubsidized loans only, and 16% borrowed from
both programs.
ALSO IMPORTANT:
Federal student loan default rates are highest for
borrowers with low balances. For example, among
borrowers entering repayment in 2010-11, the
three-year default rate ranged from 24% for those
owing $5,000 or less to 7% for those owing $40,000
or more. Two-thirds of those who defaulted owed
$10,000 or less. (Trends in Student Aid 2016,
Figure 12B)
The share of undergraduate students borrowing
federal student loans rose steadily from 23% in
2001-02 to 38% in 2011-12. Since 2011-12, the
share borrowing has declined each year, to 25% in
2021-22. (Table SA-6 online)
Federal Loan Balance by Debt Size, Second Quarter of
FY2022
Total Balance
(in Billions)
Number of
Borrowers
(in Millions)
Average
Balance
$200,000 or More $281.9 1.0 $281,900
$100,000 to $199,999 $333.3 2.4 $138,900
$80,000 to $99,999 $126.6 1.4 $90,400
$60,000 to $79,999 $181.1 2.6 $69,700
$40,000 to $59,999 $211.8 4.3 $49,300
$20,000 to $39,999 $277.8 9.7 $28,600
$10,000 to $19,999 $135.5 9.3 $14,600
$5,000 to $9,999 $54.4 7.5 $7,300
Less than $5,000 $18.9 7.1 $2,700
Total $1,621.3 45.3 $35,800
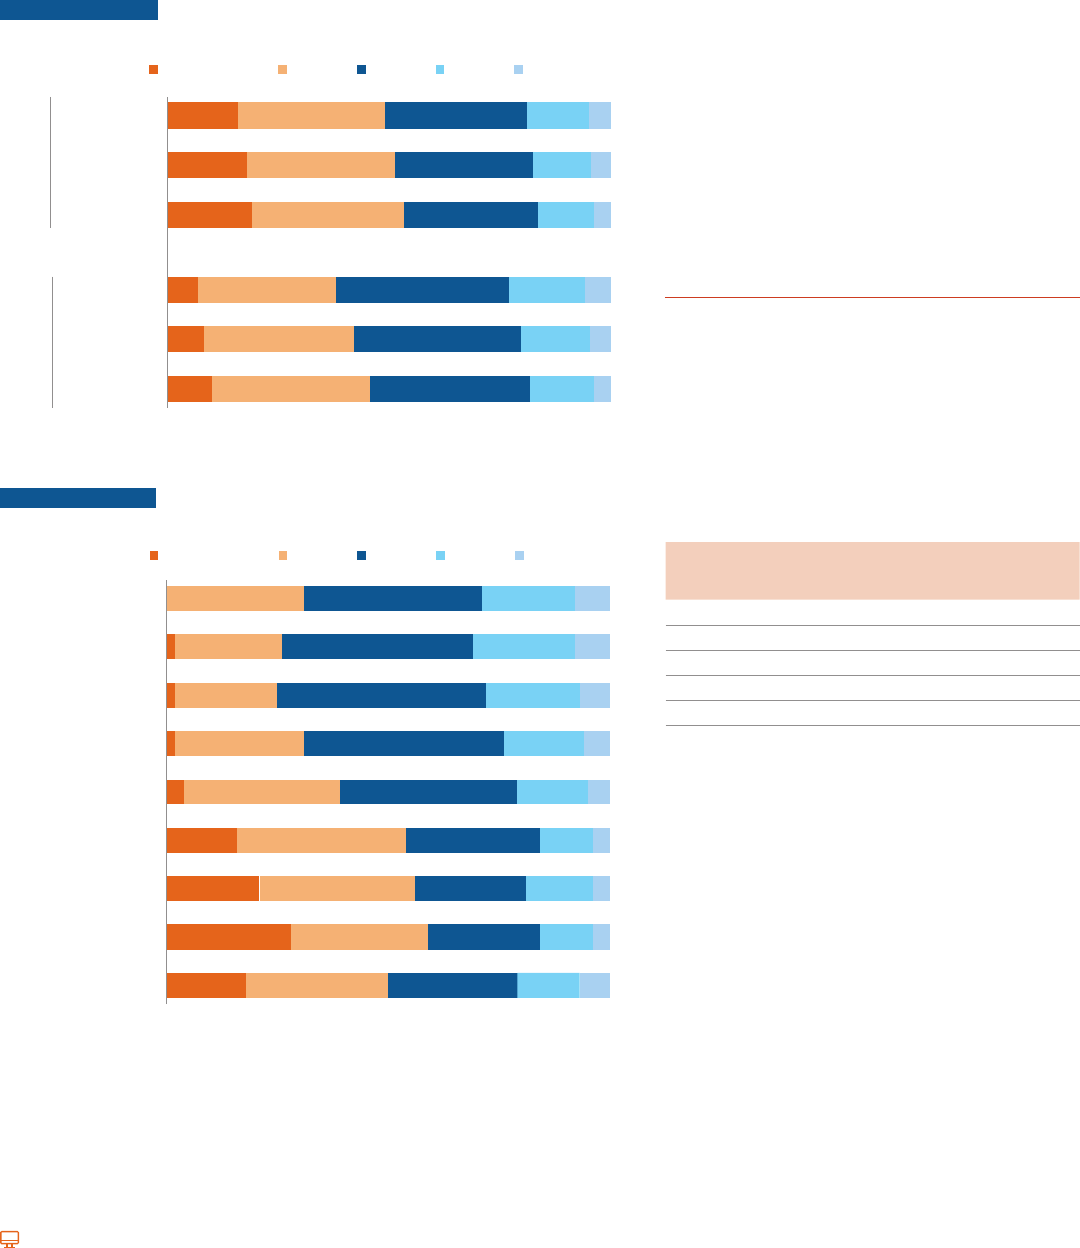
For detailed data behind the graphs and additional information, please visit: research.collegeboard.org/trends.
41
Federal Loans: Outstanding Debt by Age
As of March 2022, 24% of the $1.62 trillion outstanding federal loan balance was held by borrowers who
were 50 and older, up from 18% in 2017.
FIGURE SA-12A Distribution of Outstanding Federal Loan Dollars and Borrowers
by Borrower Age, Second Quarter of FY2017, FY2019, and FY2022
2022 (45.5 Million)
2017 (44.7 Million)
10%
7%
19%
16%
36%
31%
34%
33%
36%
39%
30%
32%
14%
18%
13%
14%
4%
6%
4%
2019 (45.2 Million)
18% 33% 31% 13% 4%
5%
Borrowers
2022 ($1.62 Trillion)
2017 ($1.34 Trillion)
8% 34% 38% 16% 5%
2019 ($1.48 Trillion)
Dollars
Fiscal Year
(Total Debt/Borrowers in Each Year)
24 and Younger 25 to 34 35 to 49 62 and Older50 to 61
FIGURE SA-12B Distribution of Borrowers by Outstanding Balance and Age,
Second Quarter of FY2022
18%
28%
21%
16%
4%
2%
2%
2%
32%
31%
35%
38%
35%
29%
23%
24%
31%
29%
25%
28%
30%
40%
45%
47%
43%
40%
14%
12%
12%
12%
16%
18%
21%
23%
21%
7%
5
%
5%
4%
5%
6%
7%
8%
8%
Less than $5,000
$5,000 to $9,999
$10,000 to $19,999
$20,000 to $39,999
$40,000 to $59,999
$60,000 to $79,999
$80,000 to $99,999
$100,000 to $199,999
$200,000 or More
Outstanding Borrower Debt Balance
24 and Younger 25 to 34 35 to 49 62 and Older50 to 61
NOTE: Includes both loans made under the Federal Direct Loan Program (FDLP) and the Federal
Family Education Loan (FFEL) Program, which ended in 2009-10. Data were as of March 31, 2022,
the end of the second quarter of FY2022. Percentages may not sum to 100 because of rounding.
SOURCE: U.S. Department of Education, Federal Student Aid Center, Federal Student
Loan Portfolio.
As of March 2022, 19% of the 45.5 million borrowers
were age 50 and older, holding 24% of all the
outstanding federal loan debt. In 2017, 17% of
borrowers were in this age group, holding 18% of all
outstanding federal loan debt.
Among the group of borrowers with outstanding
debt balances of $200,000 or more, 31% are under
age 35 and 29% are 50 or older.
Among the group of borrowers with outstanding
debt balances of less than $5,000, half are 35 or
older including 21% that are 50 or older.
ALSO IMPORTANT:
Data in Figures SA-12A and SA-12B include both
debt held by student borrowers who borrowed for
their own education and parent borrowers who
borrowed for their children’s education through
Parent PLUS loans.
Federal Loan Balance by Borrower Age, Second Quarter
of FY2022
Total Balance
(in Billions)
Number of
Borrowers
(in Millions)
Average
Balance
24 and Younger $108.2 7.2 $15,000
25 to 34 $498.1 14.9 $33,400
35 to 49 $627.0 14.5 $43,400
50 to 61 $286.6 6.3 $45,200
62 and Older $101.4 2.5 $41,100
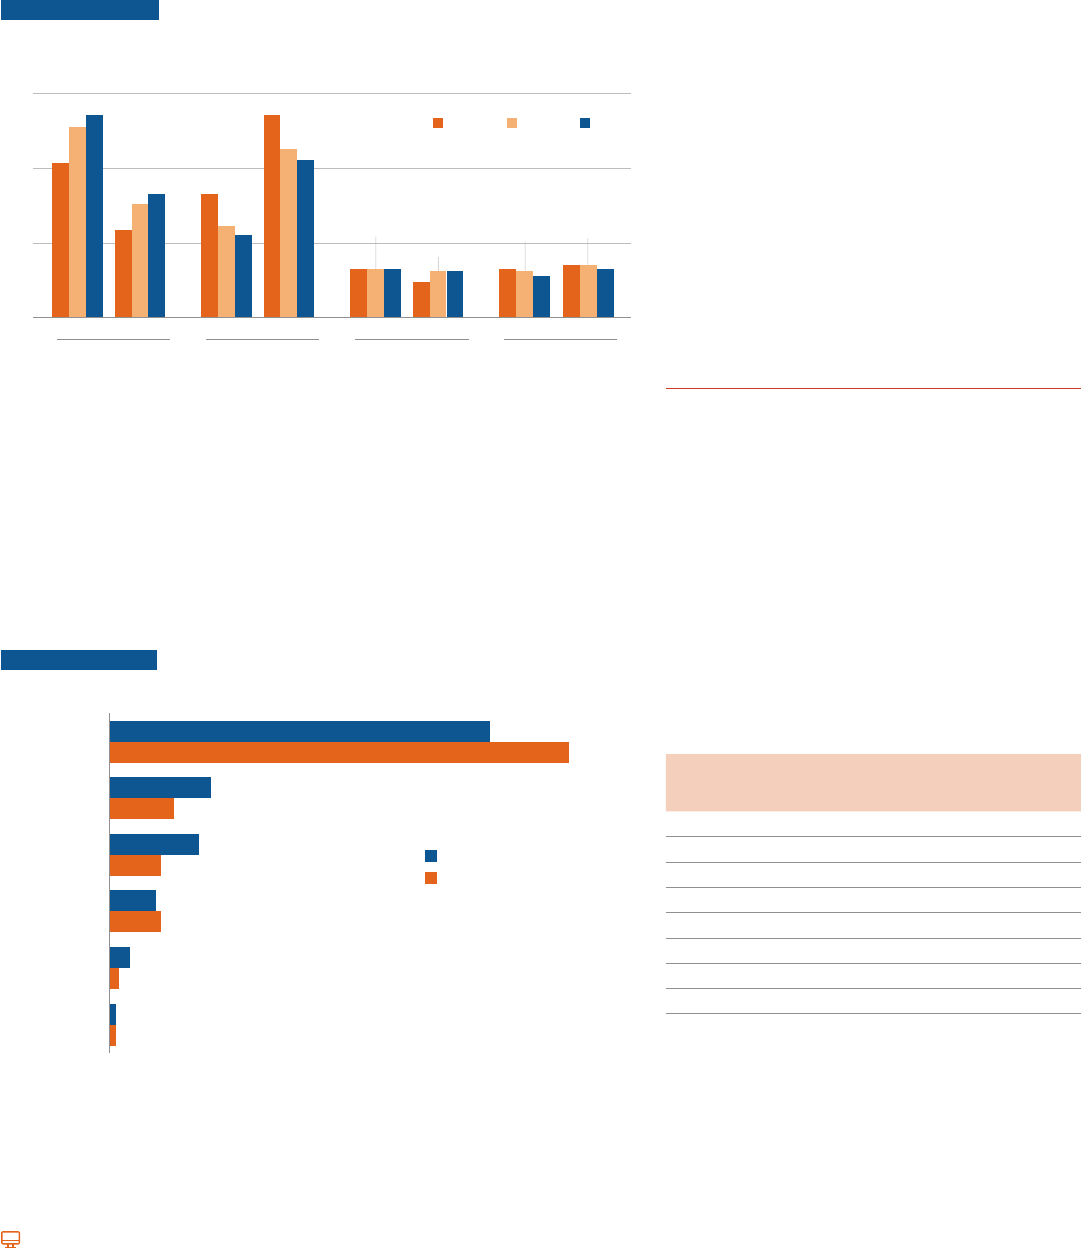
42
For detailed data behind the graphs and additional information, please visit: research.collegeboard.org/trends.
Outstanding Federal Loans
More than half of the debt owed by student loan borrowers in repayment is now in Income-Driven
Repayment (IDR) plans that limit monthly payments to a share of income.
FIGURE SA-13A Distribution of Outstanding Federal Direct Loan Dollars and
Borrowers by Repayment Plan, Second Quarter of FY2016,
FY2019, and FY2022
20192016 2022
0%
Repayment Plan
Dollars Borrowers
Income Driven
Dollars Borrowers
Level Payments,
10 Years or Less
Dollars Borrowers
Level Payments,
More Than 10 Years or
Alternative
Dollars Borrowers
Graduated Payments
20%
40%
60%
41%
33%
54%
13%
9%
13%
14%
50%
24%
45%
12%
54%
23%
30%
33%
22%
42%
13%
12%
11%
13%
13%
14%
12%
NOTE: Data include Direct Loan borrowers in repayment, deferment, and forbearance and reect
the end of the second quarter (March 31) of each scal year. Because some borrowers have multiple
loans, recipients may be counted multiple times across varying loan statuses. Income-driven plans
include REPAYE, Pay As You Earn, Income-Contingent Repayment, and Income-Based Repayment.
Level payment plans require monthly payments that are the same over a xed period of time.
Alternative repayment plans are customized to borrowers’ circumstances. Under the graduated
payment plan, monthly payments increase over time. Percentages may not sum to 100 because
of rounding.
SOURCE: U.S. Department of Education, Federal Student Aid Data Center, Federal Student
Loan Portfolio.
FIGURE SA-13B Repayment Status of Federal Education Loan Portfolio,
Second Quarter of FY2022
59%
71%
16%
10%
14%
8%
7%
8%
3%
1%
1%
1%
Repayment Status
Forbearance
Repayment
Deferment
In-School
Default
Percentage of Borrowers
Percentage of Dollars
Grace
NOTE: Includes both loans made under the Federal Direct and Federal Family Education Loan (FFEL)
programs and held by the Department of Education. Excludes the $139 billion in outstanding FFEL
loans not held by the federal government. The second quarter of FY2022 ended on March 31, 2022.
SOURCE: U.S. Department of Education, Federal Student Aid Data Center, Federal Student
Loan Portfolio.
In March 2022, 33% of borrowers in repayment on
federal Direct loans were in IDR plans, up from 23%
in 2016 and 30% in 2019.
The CARES Act and subsequent Executive Orders
suspended federal student loan payments, ended
collections on defaulted federal student loans, and
suspended interest accrual on all federal student
loans through December 31, 2022. As a result, 59%
of borrowers (and 71% of outstanding dollars) were
in forbearance in March 2022. The average balance
on these loans was $41,200.
In March 2022, 16% of borrowers (and 10% of
outstanding dollars) were in default. The average
balance on defaulted loans was $21,600, compared
with $34,100 for all outstanding loans.
ALSO IMPORTANT:
On August 24, 2022, President Biden announced
a Student Debt Relief Plan, which provides a one-
time student loan debt relief targeted to low- and
middle-income families. Through this plan, the U.S.
Department of Education will provide up to $20,000
in debt relief to Pell Grant recipients and up to
$10,000 in debt relief to non-Pell Grant recipients.
Borrowers with federal loans and individual income
of less than $125,000 (or $250,000 for households)
are eligible for this relief. (https://studentaid.gov/
de
bt-relief-announcement/one-time-cancellation)
Federal Loan Balance by Repayment Status, Second
Quarter of FY2022
Total Balance
(in Billions)
Number of
Borrowers
(in Millions)
Average
Balance
Forbearance $1,050.4 25.5 $41,200
Default $146.8 6.8 $21,600
In-School $117.3 6.0 $19,600
Deferment $117.1 3.1 $37,800
Grace $21.4 1.2 $17,800
Repayment $15.6 0.5 $31,200
Other $8.0 0.2 $40,000
Total $1,476.6 43.3 $34,100
NOTE: Forbearance: payment temporarily suspended or
reduced because of nancial hardships; Default: more than 360
days delinquent; In-School: borrower is still enrolled, loans are
not in repayment; Deferment: payments postponed because
of economic hardship, military service, or returning to school;
Grace: six-month period after borrower is no longer enrolled
at least half time; Repayment: in active repayment status. The
“Other” category includes loans that are in non-defaulted
bankruptcy and in a disability status.
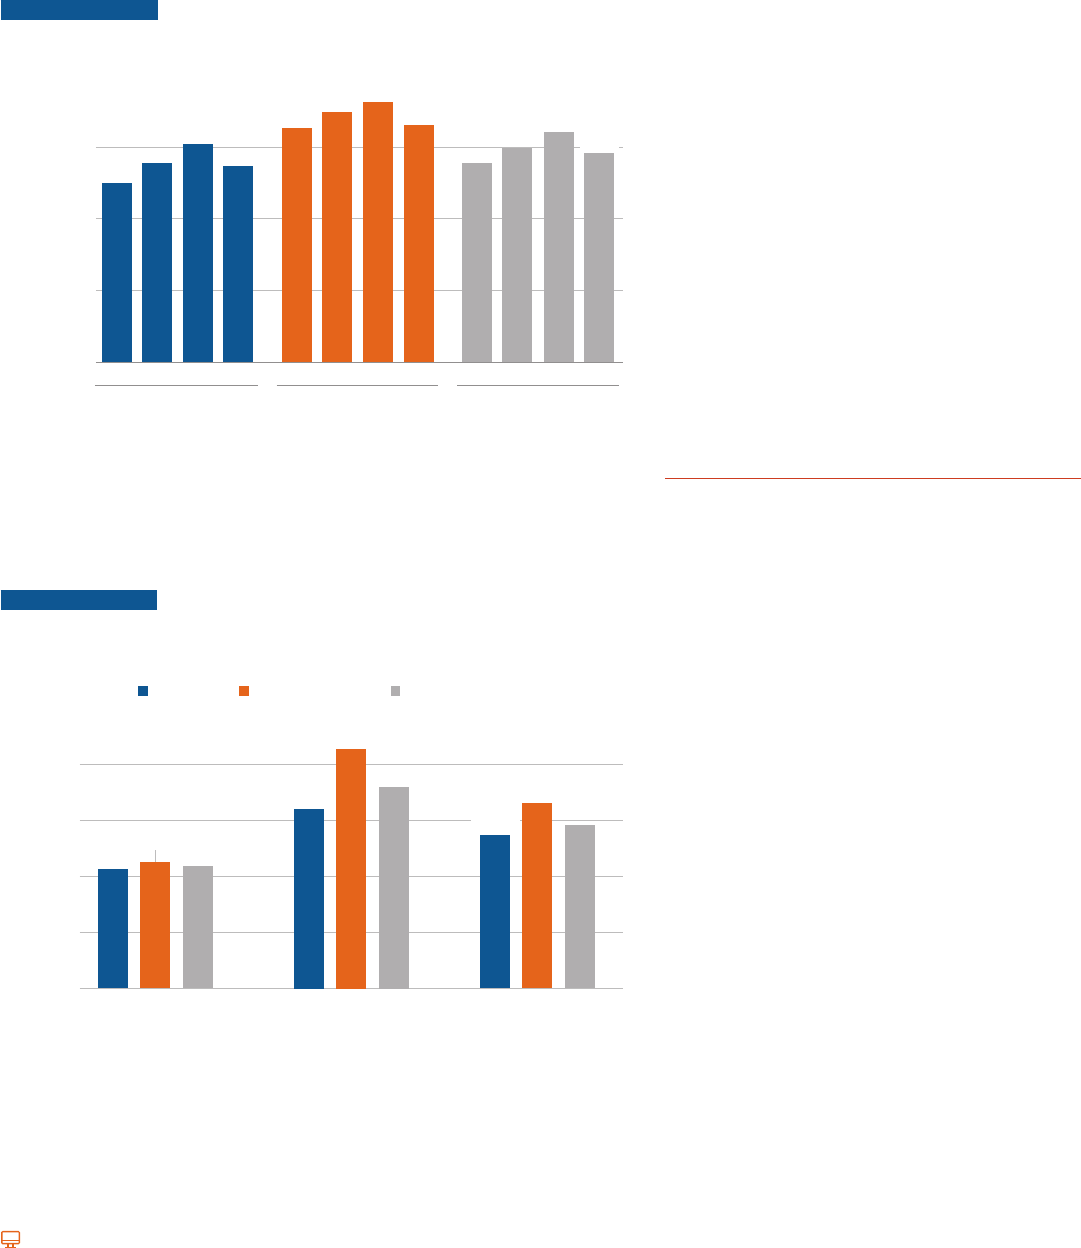
Cumulative Debt: Bachelor’s Degree Recipients
54% graduated with debt and the average debt among borrowers was $29,100.
FIGURE SA-14A Average Cumulative Debt Per Borrower in 2021 Dollars:
$36,200
$25,000
$27,700
$30,400
$27,400
$32,700
$34,900
$33,000
$27,700
$29,900
$32,100
2005-06 2015-16 2020-21 2010-11 2005-06 2015-16 2020-21 2010-11 2005-06 2015-16 2020-21 2010-11
55% 59% 53%57% 65% 62% 55%66% 58% 60% 54%60%
$29,100
$30,000
Average Cumulative
Total Debt in 2021 Dollars
$20,000
$10,000
$0
Public Four-Year Private Nonprofit Four-Year Public and Private Nonprofit
Four-Year
Academic Year (Percentage of Graduates Who Borrowed)
Includes federal and nonfederal loans taken by students who began their studies at the
institution from which they graduated. Parent PLUS loans are not included. The available data are
FIGURE SA-14B Average Cumulative Debt Per Borrower by Loan Type:
2020-21 Bachelor’s Degree Recipients at Public and Private
Public Private Nonprofit Public and Private
Four-Year Four-Year Nonprofit Four-Year
$42,800
$33,000
$29,100
Federal Loan Private Loan All Loans
51% 52%53%
$32,100
$35,900
10% 11%13% 53% 54%55%
$21,400
$22,600
$21,800
$27,400
$40,000
Average Cumulative Debt
$30,000
$20,000
$10,000
$0
Loan Type (and Percentage of Graduates Who Borrowed Each Loan Type)
All loans include federal and nonfederal loans taken by students who began their studies
at the institution from which they graduated. Parent PLUS loans are not included. The available
data are not adequate to allow comparable calculations for for-profit institutions.
Between 2015-16 and 2020-21, the average
cumulative student debt levels (in 2021 dollars)
and the shares of bachelor’s degree recipients
who
borrowed declined in both public four-year
In 2020-21, 51% of bachelor’s degree recipients
from public four-year institutions graduated
with federal loans with an average federal debt
ins
titutions graduated with federal loans with an
average federal debt level of $22,600.
In 2020-21, 10% of bachelor’s degree recipients
from public four-year institutions graduated
wi
th private loans with an average private debt
institutions graduated with private loans with an
average private debt level of $42,800.
ALSO IMPORTANT:
Students who earn their bachelor’s degrees at
SA-14A and SA-14B, are more likely to borrow
and accumulate higher average levels of debt
than those who graduate from public and private
(Trends in Student
Aid 2018
who earned their bachelor’s degrees at the
who attend two or more institutions may have
research.collegeboard.org/trends.
43
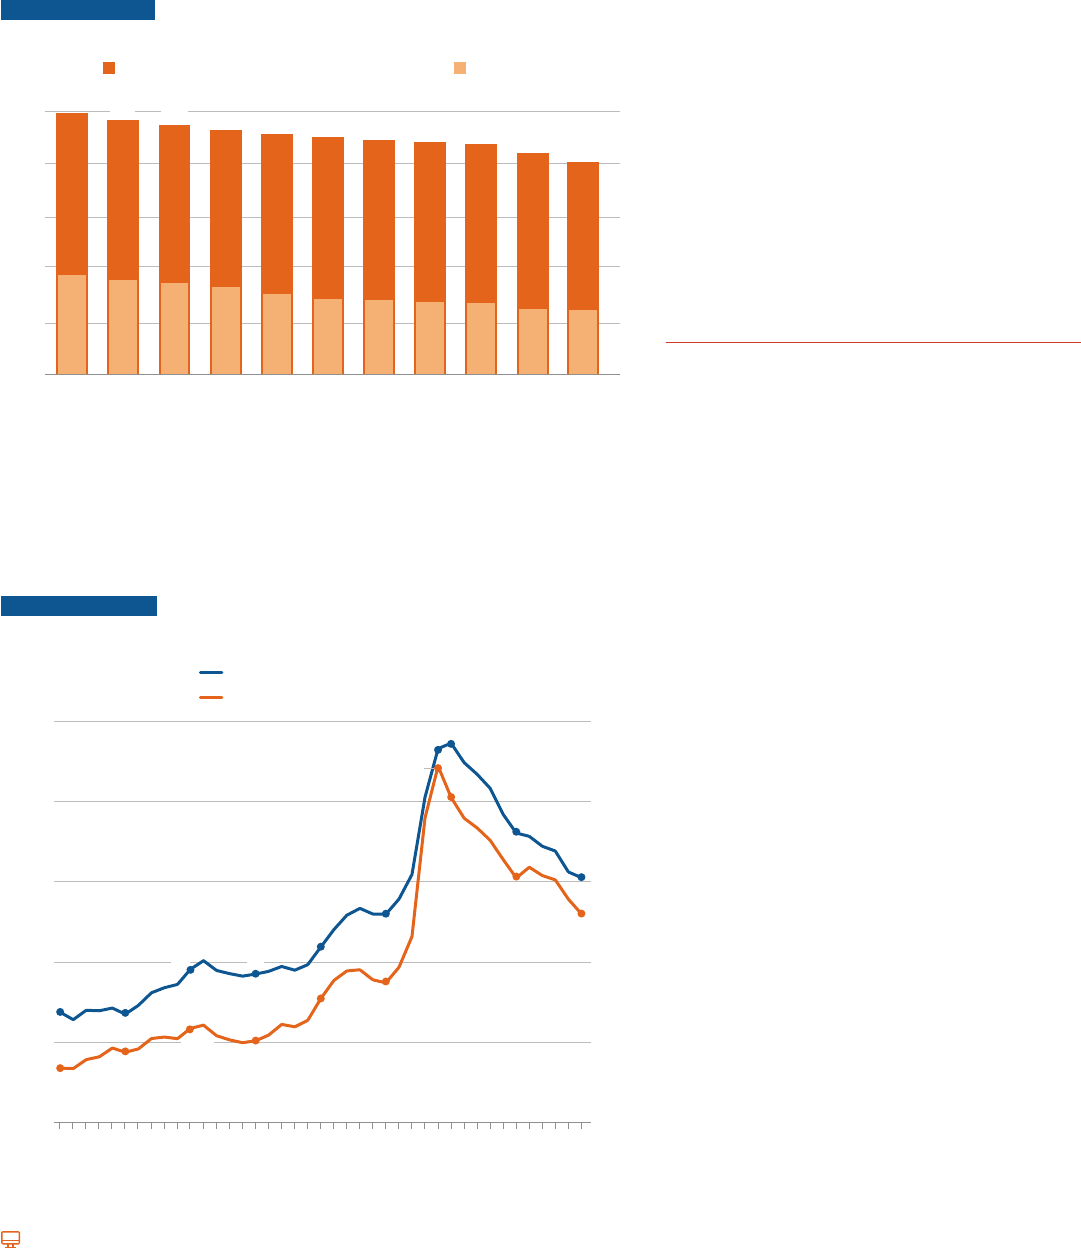
44
-
Pell Grants
Between 2011-12 and 2021-22, the number of undergraduates declined by 4.6 million (19%) and the number
of Pell Grant recipients declined by 3.4 million (36%).
FIGURE SA-15A Undergraduate Enrollment and Percentage of Undergraduate
Students Receiving Pell Grants, 2011-12 to 2021-22
0
12-Month Undergraduate Headcount Enrollment Pell Recipients
25
24.8
24.1
20
Millions of Students
20.2
21-2220-2119-2018-1917-1816-1715-1614-1513-1412-1311-12
30%
23.7
23.2
22.8
22.5
22.2
22.1
21.8
21.0
38% 37% 37% 36% 34% 32% 32% 31% 31% 30%
15
10
5
NOTE: IPEDS headcount enrollments are adjusted for the dierence between total headcount,
which counts students more than once if they are enrolled in more than one institution at the
same time, and unduplicated headcount reported by the National Student Clearinghouse (NSC).
Twelve-month undergraduate headcount for 2021-22 is estimated from the NSC data.
SOURCE: NCES, IPEDS 12-month enrollment data; National Student Clearinghouse, Current Term
Enrollment Estimates: Spring 2022; U.S. Department of Education, Federal Pell Grant Program
End-of-Year Report, 2011-12 through 2020-21; U.S. Department of Education, Federal Student Aid
Data Center, Title IV Program Volume Reports and Aid Recipients Summary; calculations by
the authors.
FIGURE SA-15B Total Pell Grant Expenditures in 2021 Dollars and Number of
Recipients, 1981-82 to 2021-22
Number of Recipients (Millions)
Total Pell Expenditures (Billions)
$50
10
9.4
$10
$20
$30
$40
$40
2
4
6
8
$8.6
$10.0
$15.3
$17.2
$40.4
$30.4
$25.9
2.7
2.7
3.8
3.7
4.3
5.2
7.2
6.1
$11.5
Total Pell Expenditures in Billions of 2021 Dollars
Number of Pell Recipients (in Millions)
9.3
$44.3
$6.5
$0 0
81-82 86-87 91-92 96-97 01-02 06-07 11-12 16-17 21-22
In 2011-12, 38% of undergraduates received Pell
Grants. The share of undergraduates receiving Pell
Grants declined to 30% in 2021-22.
Total Pell Grant expenditures reached its peak
in 2010-11 at $44.3 billion (in 2021 dollars) and
declined to $25.9 billion in 2021-22 (42% decline).
The number of Pell Grant recipients was 9.3 million
in 2010-11 and declined to 6.1 million in 2021-22
(35% decline).
Between 2020-21 and 2021-22, the number
of Pell Grant recipients declined by 2% and total
Pell Grant expenditures decreased by 7%, after
a
djusting for ination.
ALSO IMPORTANT:
Changes in Pell Grant expenditures result from
changes in the legislated maximum grant, the
formula for determining families’ ability to pay, the
number of enrolled students, the share of students
enrolling full time, and the nancial circumstances
of students and families.
SOURCE: U.S. Department of Education, Federal Pell Grant
Program End-of-Year Report, 1981-82 through 2020-21; U.S.
Department of Education, Federal Student Aid Data Center,
Title IV Program Volume Reports and Aid Recipients Summary;
calculations by the authors.
For detailed data behind the graphs and additional information, please visit: research.collegeboard.org/trends.

45
For detailed data behind the graphs and additional information, please visit: research.collegeboard.org/trends.
Pell Grants
The $6,895 maximum Pell Grant in 2022-23 is 2% lower than it was in 2021-22 and 6% higher than it was in
2002-03, after adjusting for ination.
FIGURE SA-16 Maximum Pell Grant and Published Prices at Public and Private
Nonprot Four-Year Institutions in 2022 Dollars, 2002-03 to 2022-23
02-03 07-08 12-13 17-18 22-23
$6,520
$6,895
$10,940
$39,400
$53,430
$6,690
$29,460
$40,570
$11,060
$7,090
$37,050
$50,420
$0
$10,000
$20,000
$30,000
$40,000
$50,000
2022 Dollars
Private Nonprofit Four-Year
Tuition and Fees
Maximum Pell Grant
Private Nonprofit Four-Year
Tuition and Fees and Room and
Board
Public Four-Year Tuition
and Fees
Public Four-Year
Tuition and Fees and Room and
Board
$15,770
$22,780
$23,250
NOTE: Published prices in 2022-23 declined as a result of a sharp increase in ination. The
average CPI in the rst eight months of 2022 is 8.3% higher than the rst eight months of 2021.
SOURCE: College Board, Trends in College Pricing 2022, Table CP-2 online; U.S. Department
of Education, Federal Pell Grant Program End-of-Year Report, 2002-03 through 2020-21; U.S.
Department of Education, Federal Student Aid Data Center, Title IV Program Volume Reports
and Aid Recipients Summary; calculations by the author.
The maximum Pell Grant is the most frequently
cited measure of per-student benets provided
by the program. However, most students receive
smaller grants because they are enrolled part time
or because their family incomes and assets reduce
their aid eligibility.
In 2022-23, the maximum Pell Grant covers 63%
of average published in-state tuition and fees and
30% of average tuition, fees, room, and board at
public four-year colleges and universities.
In 2022-23, the maximum Pell Grant covers 18%
of average published tuition and fees and 13% of
average tuition, fees, room, and board at private
nonprot four-year colleges and universities.
Between 2012-13 and 2022-23, average published
tuition and fees declined by 1% at public four-year
institutions and increased by 6% at private nonprot
institutions, while the maximum Pell Grant fell by 3%
after adjusting for ination.
ALSO IMPORTANT:
For the 2022-23 academic year, the maximum Pell
award is $6,895, a $400 increase from the previous
year before adjusting for ination. This is the largest
one-year increase in maximum Pell before adjusting
for ination since 2009-10. (Table SA-8)
Maximum Pell Grant as a Percentage of Published Prices
in 2022 Dollars, 2002-03 to 2022-23, Selected Years
Public Four-Year Private Nonprot Four-Year
In-State
Tuition and
Fees
Tuition
and Fees and
Room and
Board
Tuition and
Fees
Tuition
and Fees and
Room and
Board
2002-03 97% 41% 22% 16%
2007-08 70% 32% 18% 13%
2012-13 64% 31% 19% 14%
2017-18 59% 28% 17% 13%
2022-23 63% 30% 18% 13%
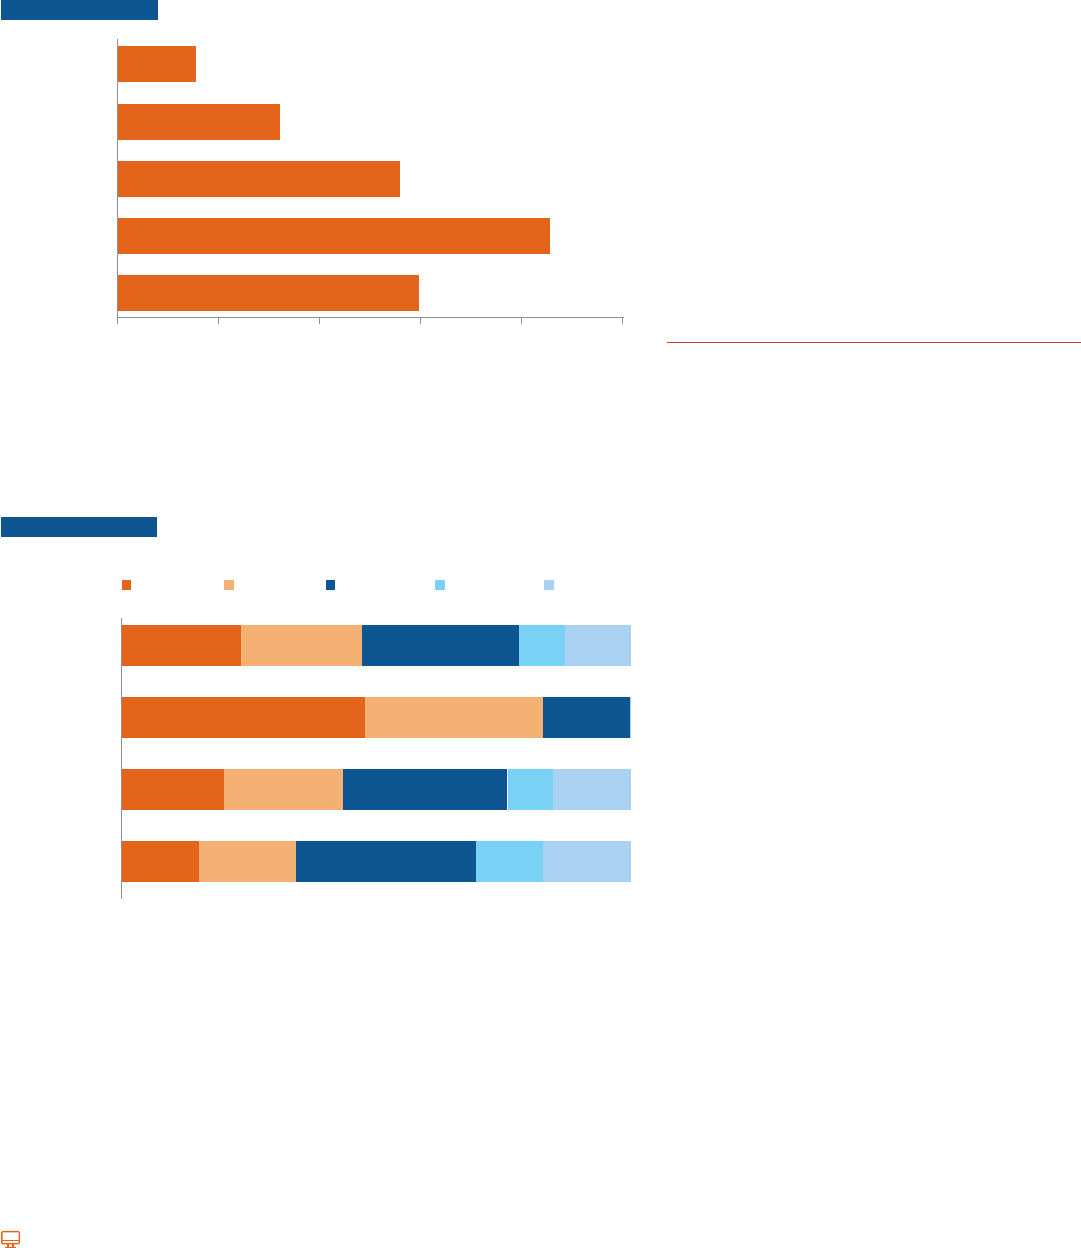
Pell Grants
In 2020-21, 58% of the 6.2 million Pell Grant recipients were younger than 24, 22% were between 24 and 30,
and 19% were older than 30.
FIGURE SA-17A Distribution of Pell Grant Recipients by Age, 2020-21
41 and Older (6%)
31 to 40 (13%)
24 to 30 (22%)
20 to 23 (34%)
19 or Younger (24%)
Number of Pell Grant Recipients (Millions)
(Total = 6.2 Million)
$0 0.5 1.0 1.5 2.0 2.5
1,491,762
2,141,351
1,395,596
804,106
388,589
Percentages on the vertical axis represent percentages of recipients in each age group.
Percentages may not sum to 100 because of rounding.
Federal Pell Grant Program End-of-Year
Report, Table 11A.
FIGURE SA-17B Distribution of Pell Grant Recipients by Dependency Status and
$9,000 or $9,001 to $20,001 to $40,001 to $50,001 or
Less $20,000 $40,000 $50,000 Higher
All Recipents
Independent Without
Dependents (21%)
Independent With
Dependents (28%)
Dependent (51%)
48% 35% 17%
23% 24% 31% 9% 13%
20% 23% 32% 9% 15%
15% 19% 35% 13% 17%
Percentages on the vertical axis represent percentages of recipients in each group.
Percentages may not sum to 100% because of rounding.
Federal Pell Grant Program End-of-Year
Report, Table 6.
In 2020-21, 51% of Pell Grant recipients were
from families with incomes of $20,000 or less, and
another 35% came from families with incomes
between $20,000 and $40,000.
Among independent Pell Grant recipients with
dependents, 43% had family incomes of $20,000
or less, and another 32% had incomes between
$20,000 and $40,000.
Nearly half of independent Pell Grant recipients
without dependents had family incomes of $9,000
and $20,000.
ALSO IMPORTANT:
The percentage of Pell Grant recipients over age
30 grew from 19% in 2000-01 to 25% in 2010-11
and declined to 19% in 2020-21. (Federal Pell
Grant Program End-of-Year Reports, 2000-01,
2010-11, and 2020-21)
In 2020-21, 10% of dependent recipients received
a Pell Grant of less than $1,500 and 45% received
$5,400 or more. (2020-21 Federal Pell Grant
Program End-of-Year Report, Table 3B)
research.collegeboard.org/trends.
46
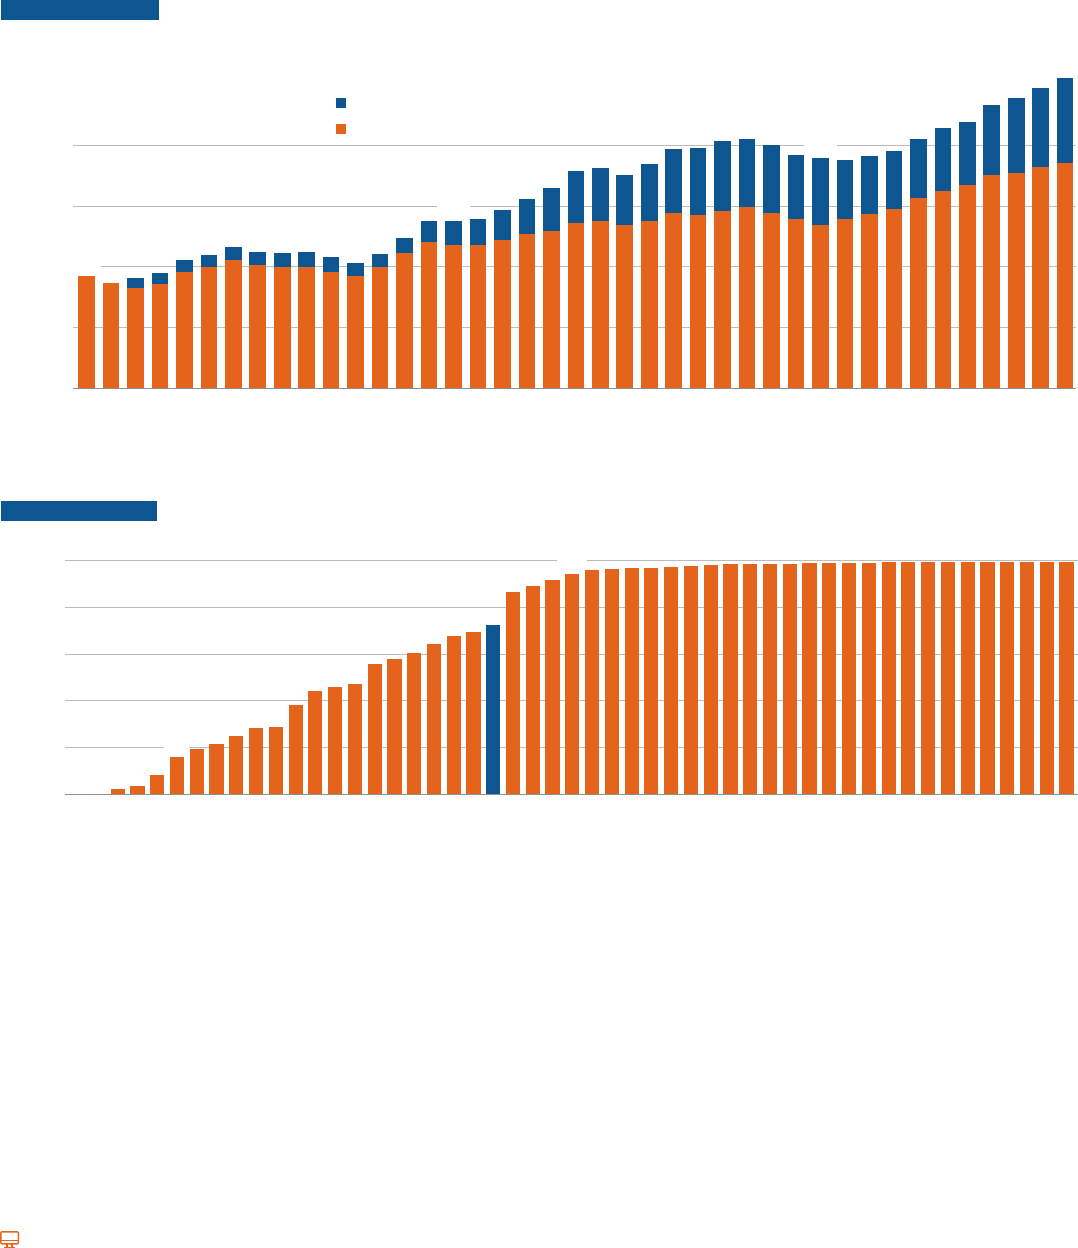
47
For detailed data behind the graphs and additional information, please visit: research.collegeboard.org/trends.
State Grants
In 2020-21, state grant aid per full-time equivalent (FTE) undergraduate student increased by 3%, from $990
to $1,020 in 2020 dollars. Average state grant aid per FTE undergraduate student has been increasing every
year since 2012-13.
FIGURE SA-18A Need-Based and Non-Need-Based State Grant Aid per Full-Time Equivalent (FTE) Undergraduate Student in 2020 Dollars,
1980-81 to 2020-21
100%
100%
91%
90%
91%
91%
91%
90%
90%
89%
88%
89%
90%
90%
87%
86%
85%
83%
82%
78%
76%
76%
77%
74%
73%
72%
72%
73%
72%
73%
71%
74%
75%
76%
76%
76%
76%
75%
74%
74%
73%
$200
$0
$400
$600
$800
Average State Grant per FTE
Undergraduate Student
Need-Based
Non-Need-Based
80-81 85-86 90-91 95-96 00-01 05-06 10-11 15-16 20-21
$440
$430
$550
$720
$790
$760
$860
$1,020
$370
NOTE: Percentages displayed represent shares of total undergraduate state grant aid that was based on students’ nancial circumstances.
SOURCE: National Association of State Student Grant and Aid Programs (NASSGAP) Annual Survey, 1980-81 to 2020-21, Tables 1 and 12.
FIGURE SA-18B Need-Based State Grant Aid as a Percentage of Total Undergraduate State Grant Aid by State, 2020-21
0%
0%
20%
40%
60%
80%
100%
Percentage of State Grants
Based on Financial Need
Georgia
Arkansas
District of Columbia
South Dakota
Louisiana
South Carolina
West Virginia
Missouri
Delaware
North Dakota
Mississippi
Oklahoma
New York
North Carolina
Washington
Massachusetts
New Jersey
Pennsylvania
Michigan
Vermont
Illinois
California
Montana
Rhode Island
Texas
Nevada
Utah
Alaska
Kentucky
Virginia
Indiana
Maryland
Idaho
Arizona
Hawaii
Maine
New Mexico
Tennessee
Florida
New Hampshire
Ohio
Iowa
United States
Alabama
Wisconsin
Connecticut
Orego
n
Colorado
Nebraska
Kansas
Minnesota
8%
16%
48%
73%
95%
99%
100%
NOTE: Need-based aid includes any grants for which nancial circumstances contribute to eligibility. Non-need-based aid refers to grants for which nancial
circumstances have no inuence on eligibility. Wyoming’s state grant aid is not disaggregated by need-based/non-need-based status.
SOURCE: NASSGAP Annual Survey, 2020-21, Table 1.
The share of state grant aid that was need-based increased from
a low of 71% in 2010-11 to 76% between 2013-14 and 2016-17. It
was 73% in 2020-21.
In 2020-21, 26 states considered students’ nancial circumstances
in allocating at least 95% of their state grant aid. Fourteen states
and the District of Columbia considered students’ nancial
circumstances when awarding less than half of their state grant aid.
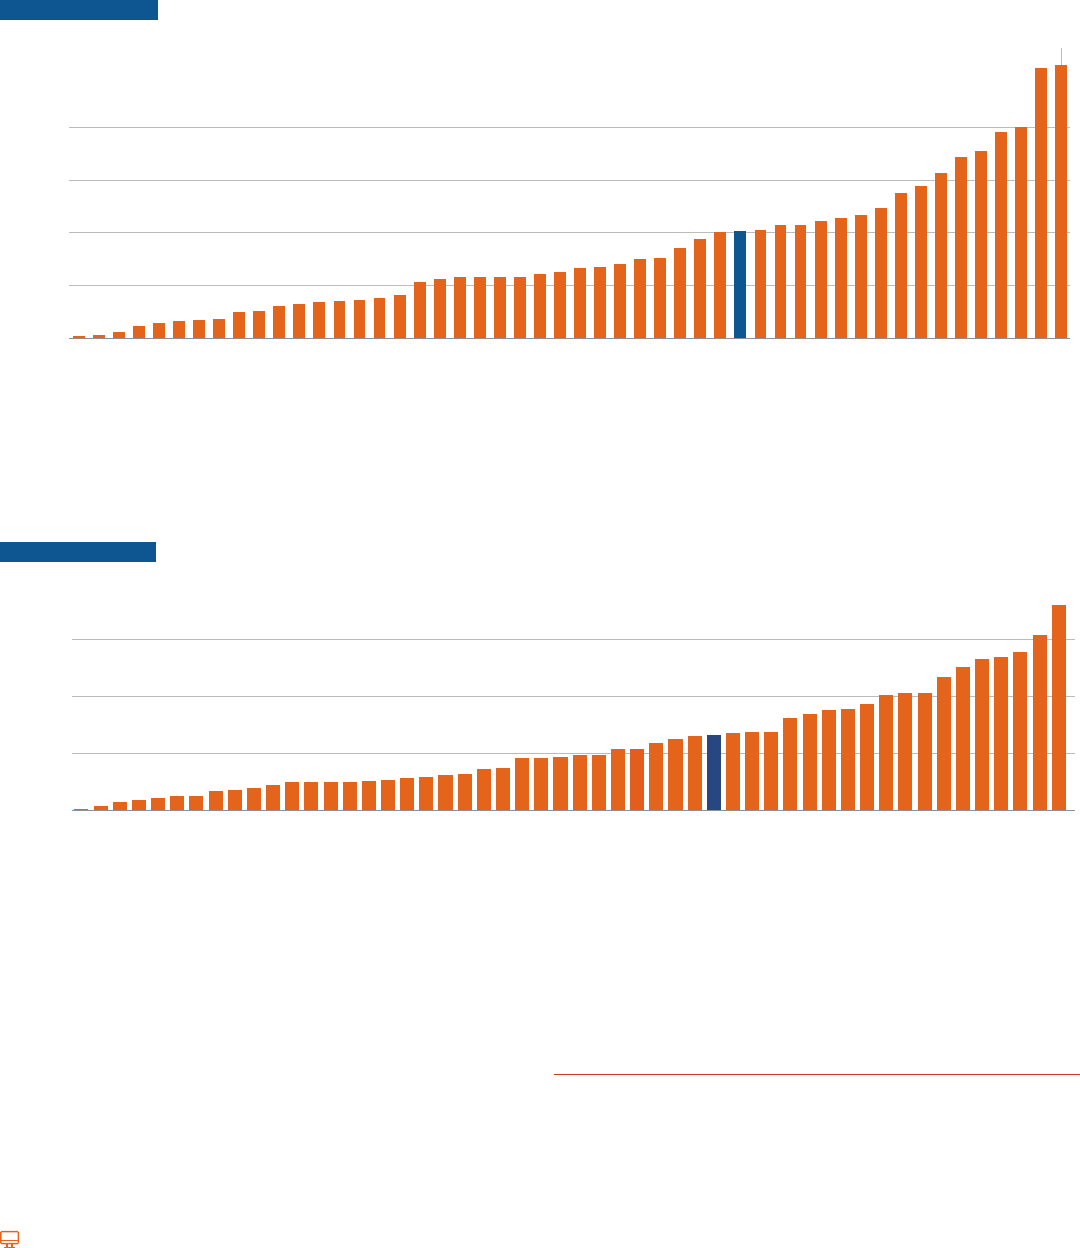
For detailed data behind the graphs and additional information, please visit: research.collegeboard.org/trends.
48
State Grants
In 2020-21, state grant aid per full-time equivalent (FTE) undergraduate student ranged from under $200 in
eight states to over $2,000 in three states.
FIGURE SA-19A State Grant Aid per Full-Time Equivalent (FTE) Undergraduate Student, 2020-21
$2,590
Montana
$20
$180
$1,020
$0
$500
$1,000
$1,500
$2,000
State Grant Aid per FTE Student
$2,570
New Hampshire
Utah
Arizona
Kansas
Hawaii
Rhode Island
South Dakota
Connecticut
Mississippi
Vermont
Missouri
Oklahoma
Colorado
North Carolina
Idaho
Alabama
Ohio
Maine
Iowa
Delaware
Pennsylvania
Nevada
Minnesota
Tex a s
Nebraska
Michigan
Massachusetts
Maryland
Wisconsin
North Dakota
District of Columbia
Oregon
New York
United States
Indiana
Kentucky
New Jersey
Tennessee
Louisiana
Arkansas
Illinois
Alaska
Florida
Virginia
Georgia
South Carolina
California
New Mexico
West Virginia
NOTE: Full-time equivalent students include both state residents and out-of-state students. States do not award grant aid to nonresidents. Most states do not
award state grant aid to their residents who attend colleges outside the state.
SOURCE: NASSGAP Annual Survey, 2020-21, Tables 1 and 12.
FIGURE SA-19B State Grant Expenditures as a Percentage of Total State Support for Higher Education by State, 2020-21
13%
31%
36%
<1%
Grant Aid as a Percentage
of Fiscal Support
0%
10%
20%
30%
Montana
Hawaii
Utah
New Hampshire
Kansas
South Dakota
Connecticut
Alabama
Nebraska
Idaho
Wyoming
Mississippi
Arizona
Rhode Island
Alaska
Maryland
Maine
Michigan
North Dakota
Ohio
Massachusetts
Wisconsin
North Carolina
Nevada
Oregon
Illinois
Iowa
New Mexico
Oklahoma
Delaware
Arkansas
Minnesota
New York
United States
Texas
California
Vermont
West Virginia
Florida
Indiana
Pennsylvania
Washington
New Jersey
Tennessee
Kentucky
Georgia
Virginia
District of Columbia
Colorado
Louisiana
South Carolina
Missouri
5%
NOTE: State grant expenditures include funding for both undergraduate and graduate students.
SOURCE: NASSGAP Annual Survey, 2020-21, Table 14.
South Carolina, with the highest grant aid per FTE undergraduate
student, considered the nancial circumstances of recipients for
only 16% of state grant funds in 2020-21. Georgia, with the second
highest grant aid per FTE undergraduate student, allocates its
grant funds without regard to students’ nancial circumstances.
(Figure SA-18B)
Overall, state grant expenditures constituted 13% of total state
support for higher education in 2020-21. State grant expenditures
constituted 5% or less of total state support for higher education
in 17 states and 20% or more in 10 states.
ALSO IMPORTANT:
In 2020-21, six states (California, New York, Texas, Florida, Georgia,
and Virginia) accounted for 53% of all state grant aid dollars, with
California accounting for 18% of the total.
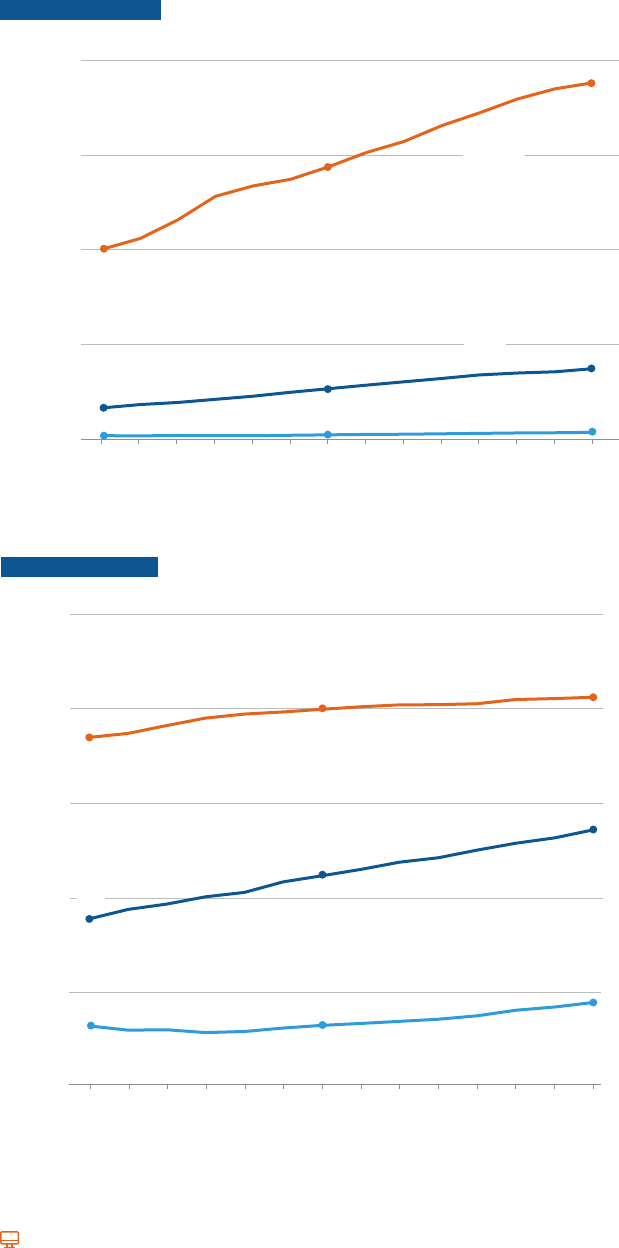
49
Average Institutional Grant Aid by Sector
from $10,070 to $18,860 in 2019 dollars.
FIGURE SA-20A
$20,000
06
-
07 07
-
08 08
-
09 09
-
10 10
-
11 11
-
12 12
-
13 13
-
14 14
-
15 15
-
16 16
-
17 17
-
18 18
-
19 19
-
20
$10,070
$14,420
$18,860
$1,680
$2,690
$3,750
$210
$250
$380
$5,000
$10,000
$15,000
Average Institutional Grant Aid per Student
$0
Public
Two-Year
Private
Nonprot
Four-Year
Public
Four-Year
FIGURE SA-20B
Receiving Institutional Grant Aid, 2006-07 to 2019-20
100%
Private
Nonprot
83%
Four-Year
60%
Public
57%
Four-Year
46%
40%
35%
80%
80%
73%
Percentage of Students Receiving Institutional Grant Aid
Public
18%
20%
Two-Year
12%
12%
0%
06
-
07 07
-
08 08
-
09 09
-
10 10
-
11 11
-
12 12
-
13 13
-
14 14
-
15 15
-
16 16
-
17 17
-
18 18
-
19 19
-
20
Between 2006-07 and 2019-20, average
at public four-year institutions more than doubled
2
019 dollars.
Between 2006-07 and 2019-20, average
at public two-year institutions increased by 81%
2019 dollars.
undergraduate students receiving institutional
grant aid were 18% at public two-year, 57% at public
institutions.
Between 2006-07 and 2019-20, the share of
receiving institutional grant aid increased at all
three sectors, with the largest increase in the public
four-year sector, from 35% in 2006-07 to 57% in
2019-20.
research.collegeboard.org/trends.

50
research.collegeboard.org/trends.
Notes and Sources: Trends in College Pricing
THE ANNUAL SURVEY OF COLLEGES
four-year sectors in this report are based on data collected through
over the course of a nine-month academic year of 30 semester hours
or 45 quarter hours.
ENROLLMENT-WEIGHTED AND UNWEIGHTED DATA
This report provides enrollment-weighted average tuition prices.
Charges of institutions with larger full-time enrollments are weighted
more heavily than those of institutions with smaller enrollments.
phenomena. The weighted averages may be more helpful to students
and families in anticipating future education expenses. Some researchers,
useful in studying longitudinal trends and evaluating a particular
institution’s practices against a larger set. Thus, we compute both
weighted and unweighted averages. Tables reporting unweighted tuition
data can be found online at research.collegeboard.org/trends.
Weighted averages of tuition prices are based on relevant populations:
In-state tuition and fees are weighted by full-time undergraduate
enrollment.
Out-of-state tuition and fees are calculated by adding the nonresident
premium, weighted by full-time out-of-state enrollment, to average
in-state tuition and fees.
In Trends in College Pricing 2019 and earlier editions, room and board
charges as well as other expenses were weighted by the number of
undergraduate students residing on campus for four-year institutions
and by the number of commuter students for public two-year institutions.
Books and supplies were weighted by full-time undergraduate enrollment.
average one-year percent change to the previous year’s sector averages.
LONGITUDINAL DATA
In online Table CP-2, tuition averages for years prior to 1987-88 are
full-time equivalent enrollments, while the Annual Survey of Colleges
and fee data may be based on 24 semester hours while the Annual Survey
of Colleges data are based on 30 semester hours.
NET PRICE CALCULATIONS
calculated by subtracting from published prices average grant aid per
College Board’s Annual Survey of Colleges. Average grant aid is
federal, state, and institutional grants.
This year’s net prices are not comparable with those reported in
Trends in College Pricing 2019 and earlier editions because of changes
in methodology.
INFLATION ADJUSTMENT
We use the annual Consumer Price Index for all urban consumers (CPI-U)
at the time of analysis, we estimate the 2022 CPI by assuming an annual
August 2022 CPI from the same months in 2021. In 2020 and earlier, we
in the CPI-U over time. Online Table CP-A1 provides CPI data used to

51
research.collegeboard.org/trends.
Notes and Sources: Trends in Student Aid
Campus-Based Aid (FWS, Perkins, and FSEOG) and ACG/SMART
Grants:
institutional grants. No funds were appropriated for new federal capital
for schools to make new Perkins loans ended on September 30, 2017.
Federal Tax Credits and Deductions: Statistics of Income, Individual
Complete Report (Publication 1304), Tables 1.3, 1.4, and 3.3. Data on
education tax credits are authors’ estimates based on IRS data on the
volume of Hope, Lifetime Learning, and American Opportunity credits
for tax years 1998 and later. A portion of nonrefundable dollars claimed
on nontaxable returns is excluded to account for credits that do not
reduce tax liability. Tax deductions are based on IRS Statistics of Income
Table 1.4. The savings from the tuition tax deduction are estimated by the
authors based on the marginal tax rates applied to the taxable income of
the taxpayers in each income bracket claiming the deduction on taxable
returns. Calendar year amounts are split between the two associated
academic years.
Federal Subsidized and Unsubsidized Student Loans:
2009-10 and prior: unpublished data provided by the U.S. Department
Center will continue to update the loan volume after each academic
year ends, we adjusted the 2021-22 data (released in late 2022) using
the average of the percentage changes between: (1) July 2021 and July
for the reported 2018-19 loan volume.
Prior to 1993-94, federal Subsidized and Unsubsidized loans for
students were made by banks and other private lenders and guaranteed
Subsidized loans are need-based student loans for which the federal
government pays the interest while the student is in school and during
a six-month grace period thereafter. Prior to June 2012, these loans
were available to both undergraduate and graduate students, but
the Budget Control Act of 2011 eliminated the program for graduate
students, whose federal loans are now all Unsubsidized or grad PLUS
loans. Interest accrues on Unsubsidized loans from the time they
are disbursed.
Institutional Grants:
approximations and are updated each year as additional information
becomes available.
Nonfederal Loans:
from MeasureOne. Between 2011-12 and 2016-17, we supplemented
these data with information from the Consumer Bankers Association
on information provided by lenders supplemented by data from annual
reports and from National Postsecondary Student Aid Study (NPSAS).
as well as a survey of institutions conducted for College Board by the
We no longer report state and institutional loans separately from private
loans because of changes in MeasureOne’s methodology and data
availability issues.
Pell Grant Program: Federal Pell Grant Program
End-of-Year Report
Program Volume Reports.
Private and Employer Grants:
in NPSAS and College Board’s Annual Survey of Colleges.
State Grant Programs: 20th through 52nd Annual Survey Reports of
the National Association of State Student Grant and Aid Programs for
1988-89 to 2020-21 and estimated for 2021-22.
Veterans’ Benefits:
education and training to veterans and their dependents, including the
Post-9/11 GI Bill established in 2009-10 and all programs established
earlier. The Iraq and Afghanistan Service Grants program, begun in
2010-11, provides non-need-based grants for students whose parent
Afghanistan as a result of performing military service after Sept. 11,

52
research.collegeboard.org/trends.
About College Board
College Board is a mission-driven not-for-profit organization that connects
was created to expand access to higher education. Today, the membership
association is made up of over 6,000 of the world’s leading educational institutions
College Board helps more than seven million students prepare for a successful
transition to college through programs and services in college readiness and
college success—including the SAT
®
and the Advanced Placement Program
®
.
The organization also serves the education community through research and
visit www.collegeboard.org.
Trends in Higher Education
Trends in College Pricing
and Trends in Student Aid, Education Pays, and other research briefs. These reports
are designed to provide a foundation of evidence to strengthen policy discussions
and decisions.
The tables supporting all of the graphs in this report, a PDF version of the report, and
a PowerPoint file containing individual slides for all of the graphs are available on
our website research.collegeboard.org/trends.
Please feel free to cite or reproduce the data in this report for noncommercial purposes with proper attribution.
trends@collegeboard.org.
© 2022 College Board. College Board, Advanced Placement Program, SAT, and the acorn logo are registered
trademarks of College Board. All other marks are the property of their respective owners.
Visit College Board on the web: collegeboard.org.
MAR-5555-2022
October 2022

